Identify the most effective acquisition channel
Background
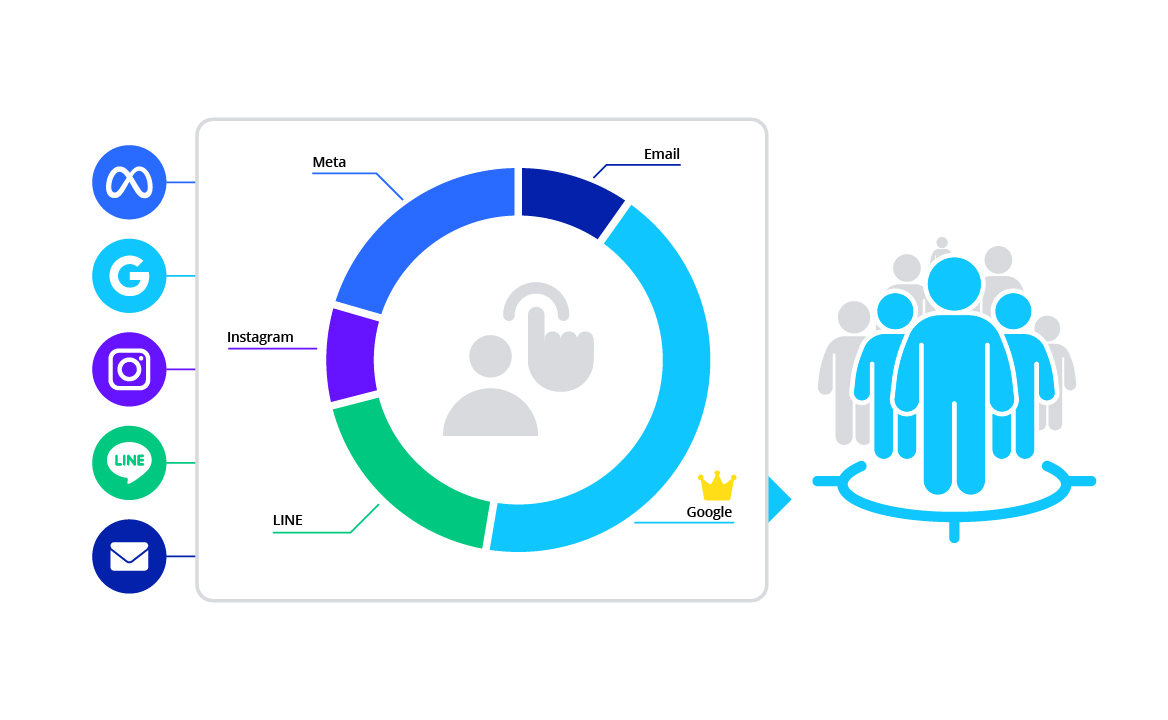
To effectively reach potential users, brands must utilize multiple channels, including email, SMS, paid ads (including Google and Facebook), and social media (including Instagram and LINE). However, data across these channels is often scattered and not consolidated, making it challenging for marketers to evaluate each channel's effectiveness.
Objective
How do I identify the most effective channels to acquire new users?
Challenges
- Lack of a centralized source for analyzing and comparing acquisition channels.
- Creating reports manually is time-consuming, and reports must be recreated whenever new data is available.
Appier's solution
- Product: AIRIS
- Feature: Attribution report
- AIRIS's attribution reports allow marketers to easily quantify the effectiveness of various touchpoints and campaigns leading to conversions. Marketers can then leverage these insights to create segments for further retargeting efforts.
- Strengths:
- Report data visualizations enable easy analysis of cross-channel acquisition performance.
- Automatically updated data ensures accurate and up-to-date performance tracking.
- Segments can be easily leveraged across various integrated platforms for targeted marketing efforts.
Setup guide
1. Create a new attribution report
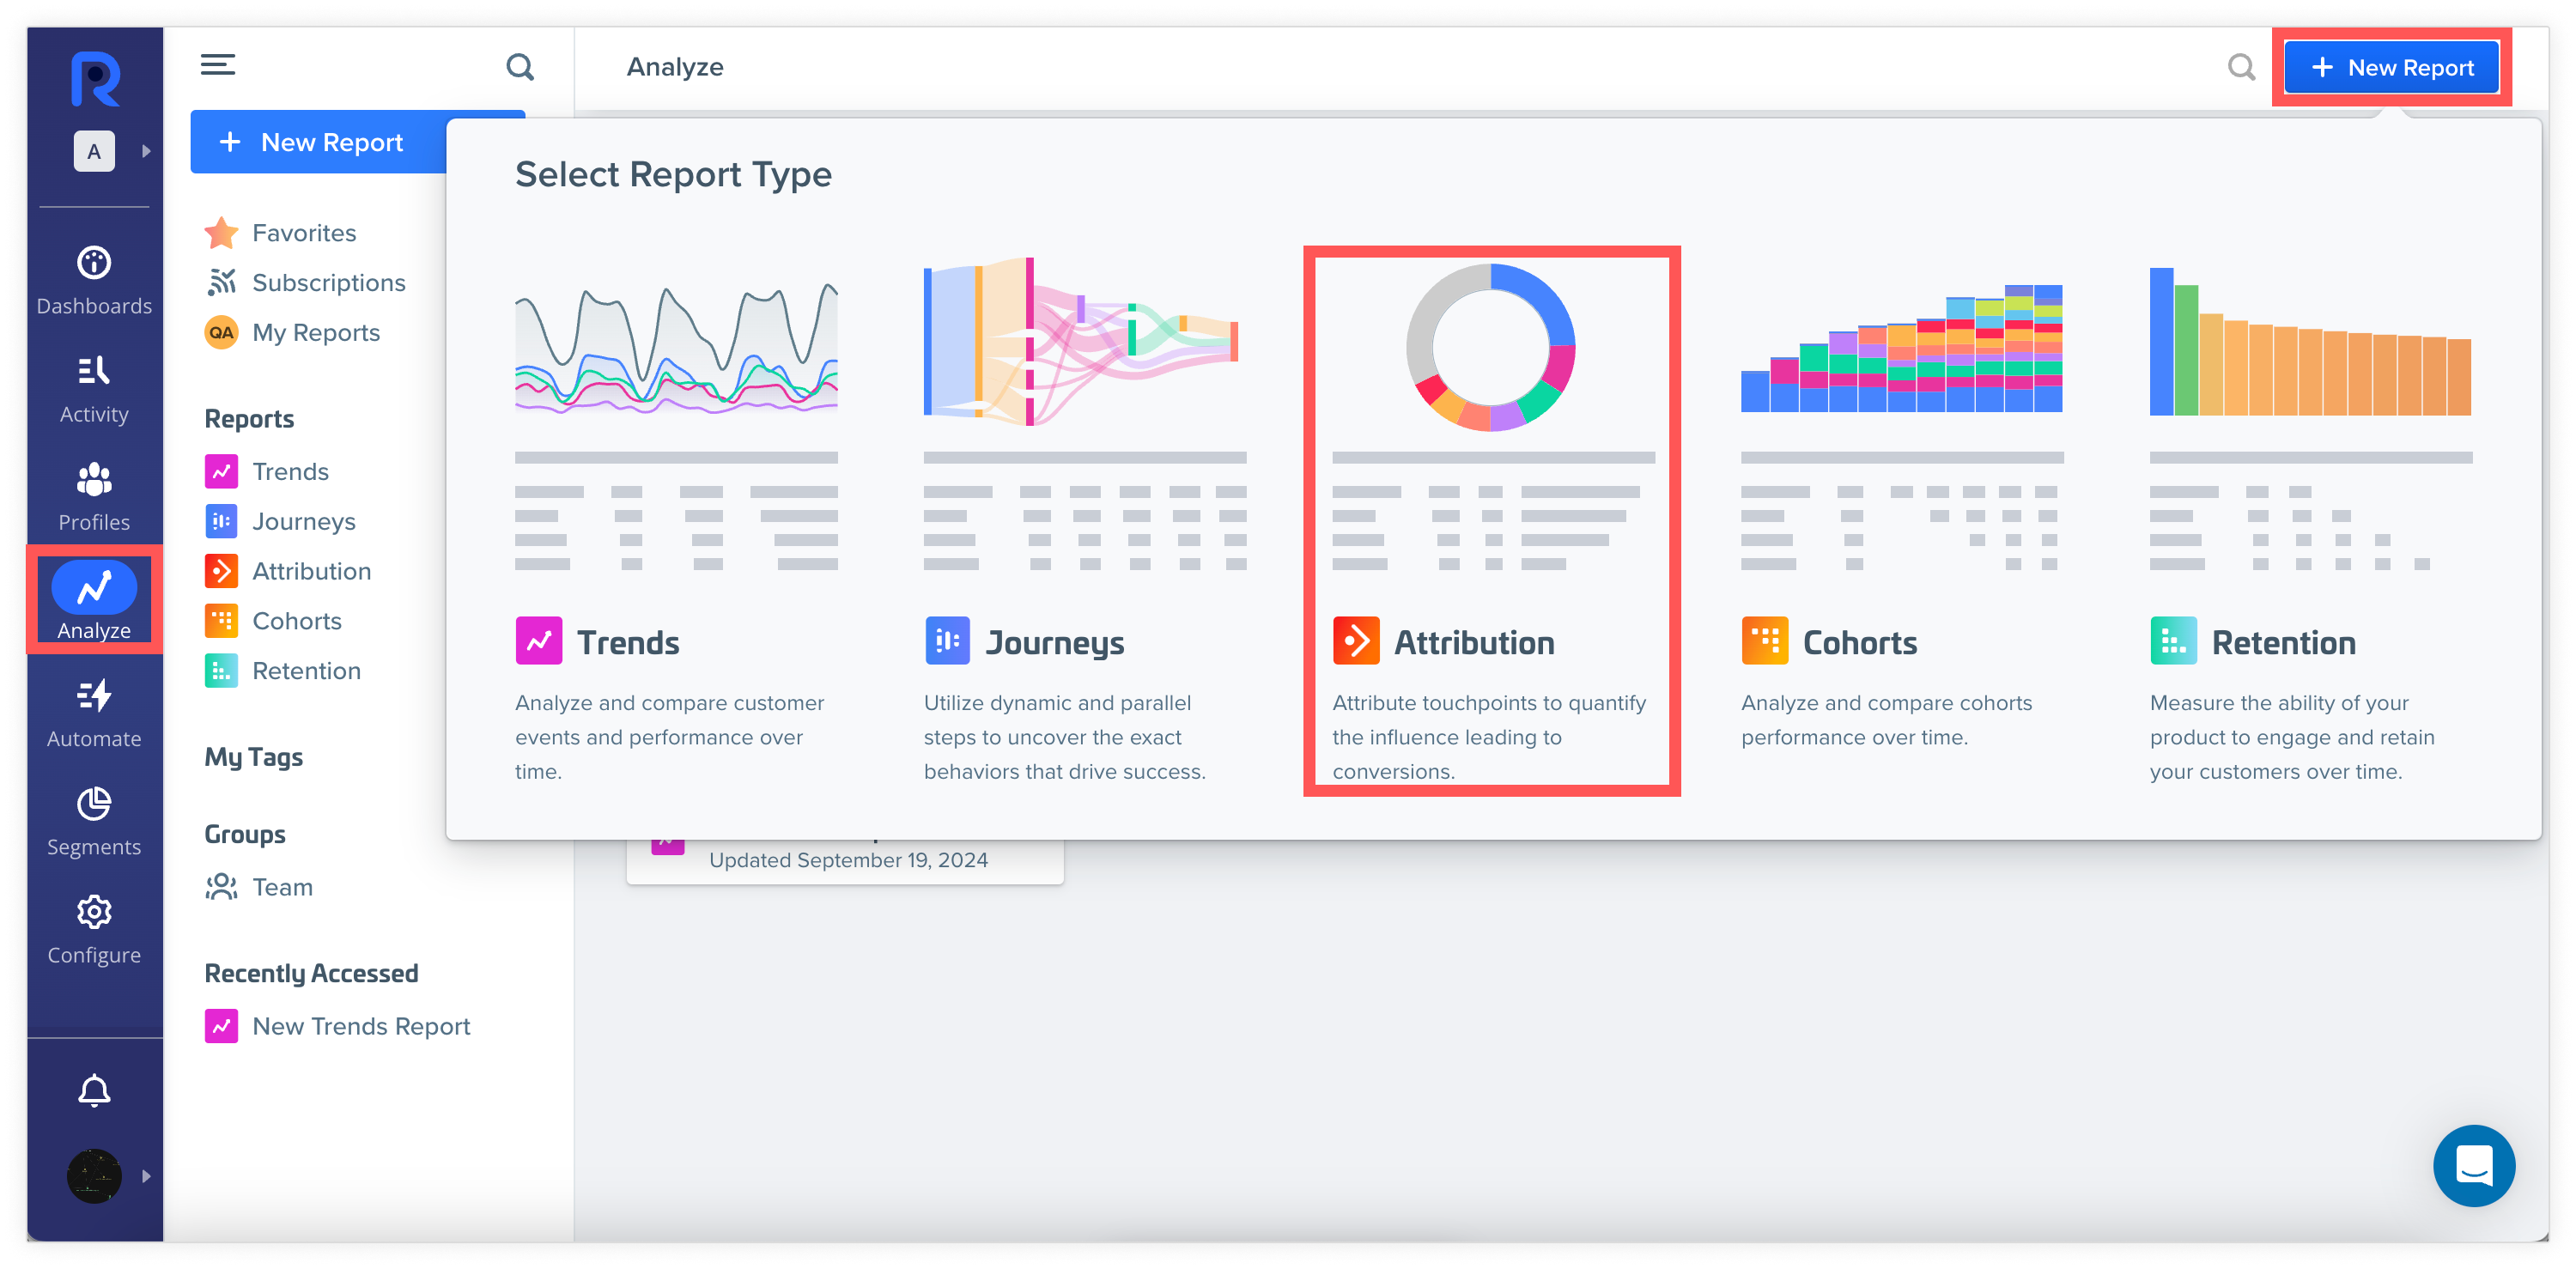
From navigation sidebar, go to Analyze, then click + New Report > Attribution.
2. Configure report settings
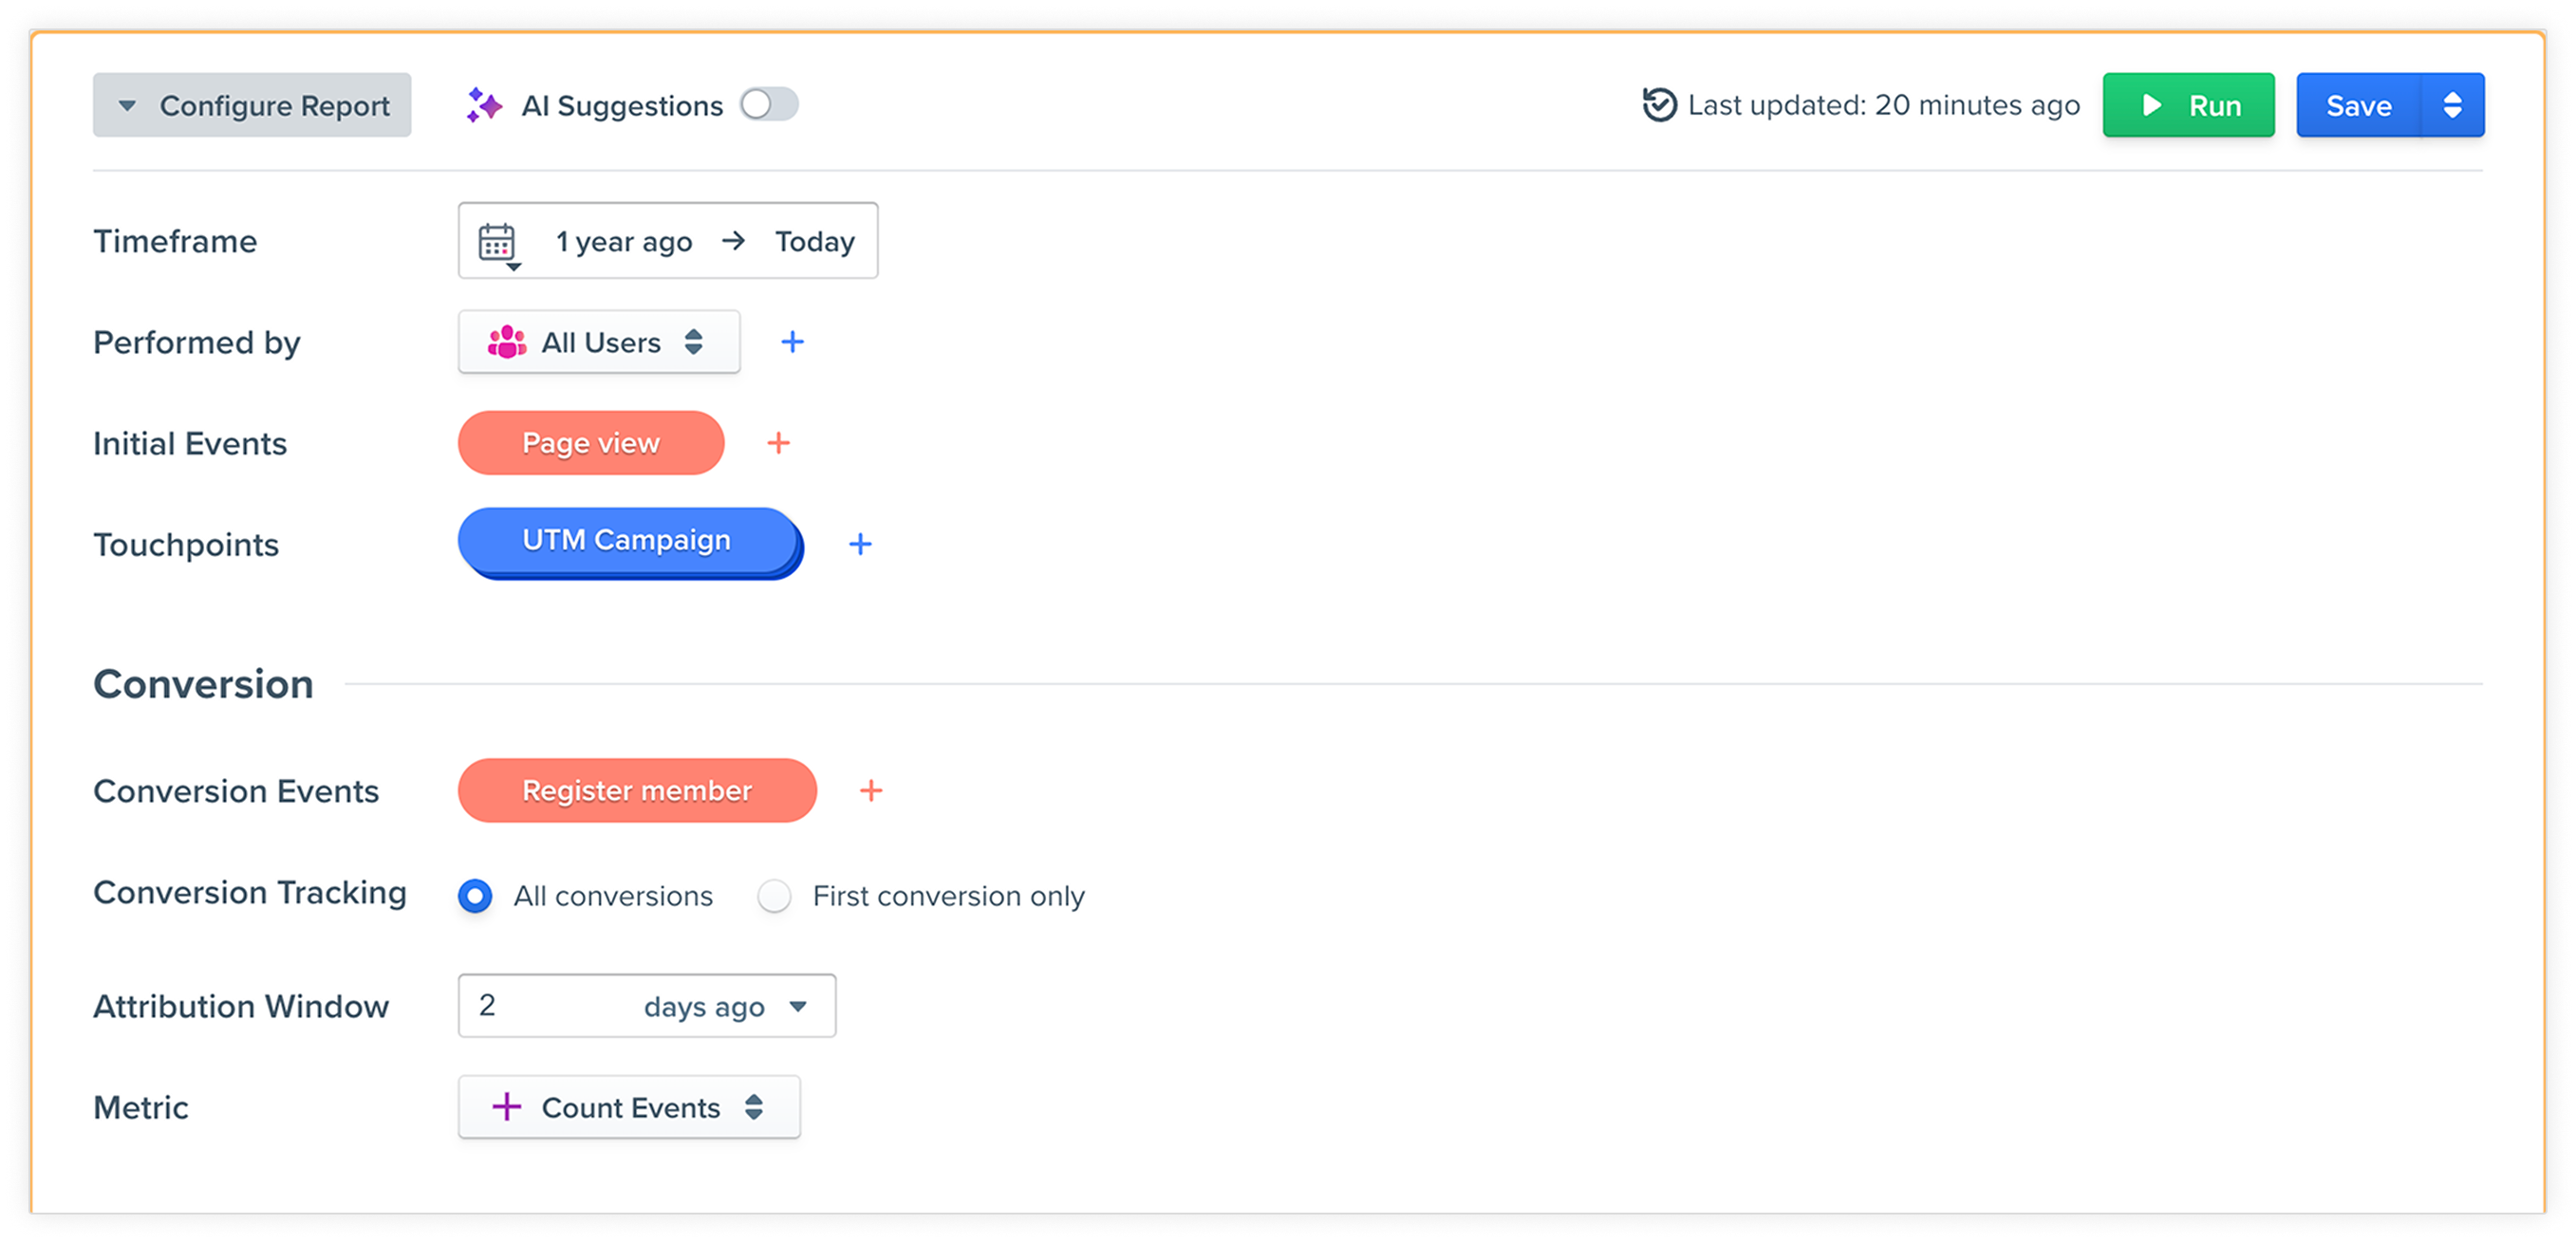
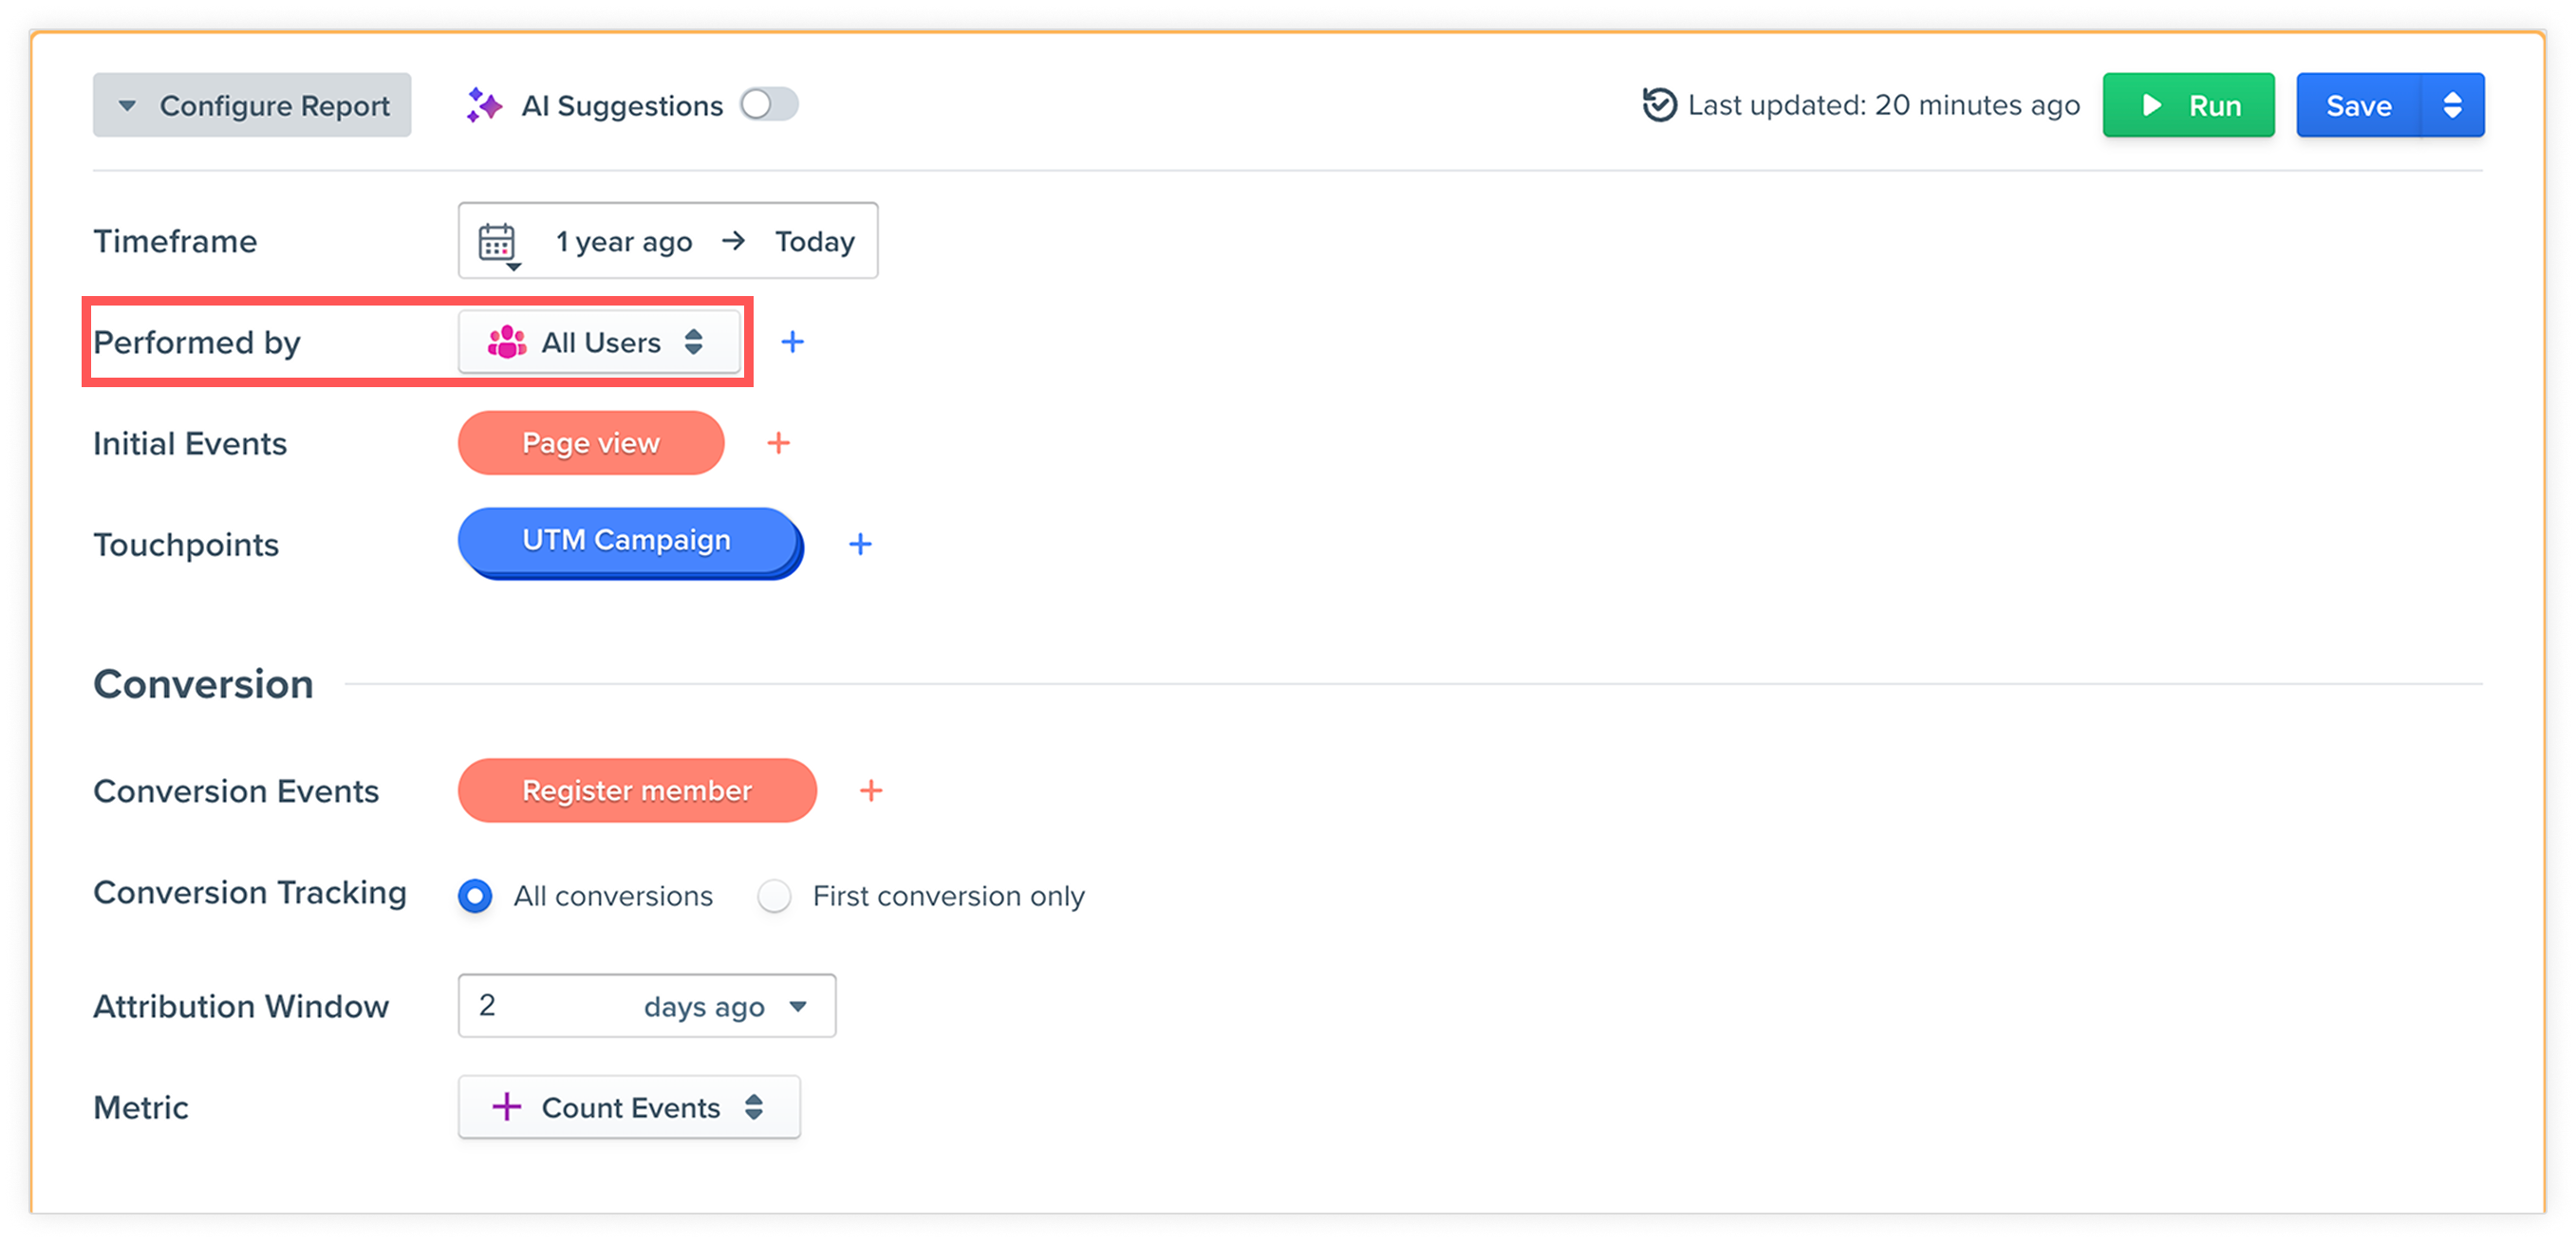
In this example, we want to assess how many website visitors in the past year from each acquisition channel (such as Google, Facebook) have converted into registered members. To do so, we'll configure the following settings:
Timeframe
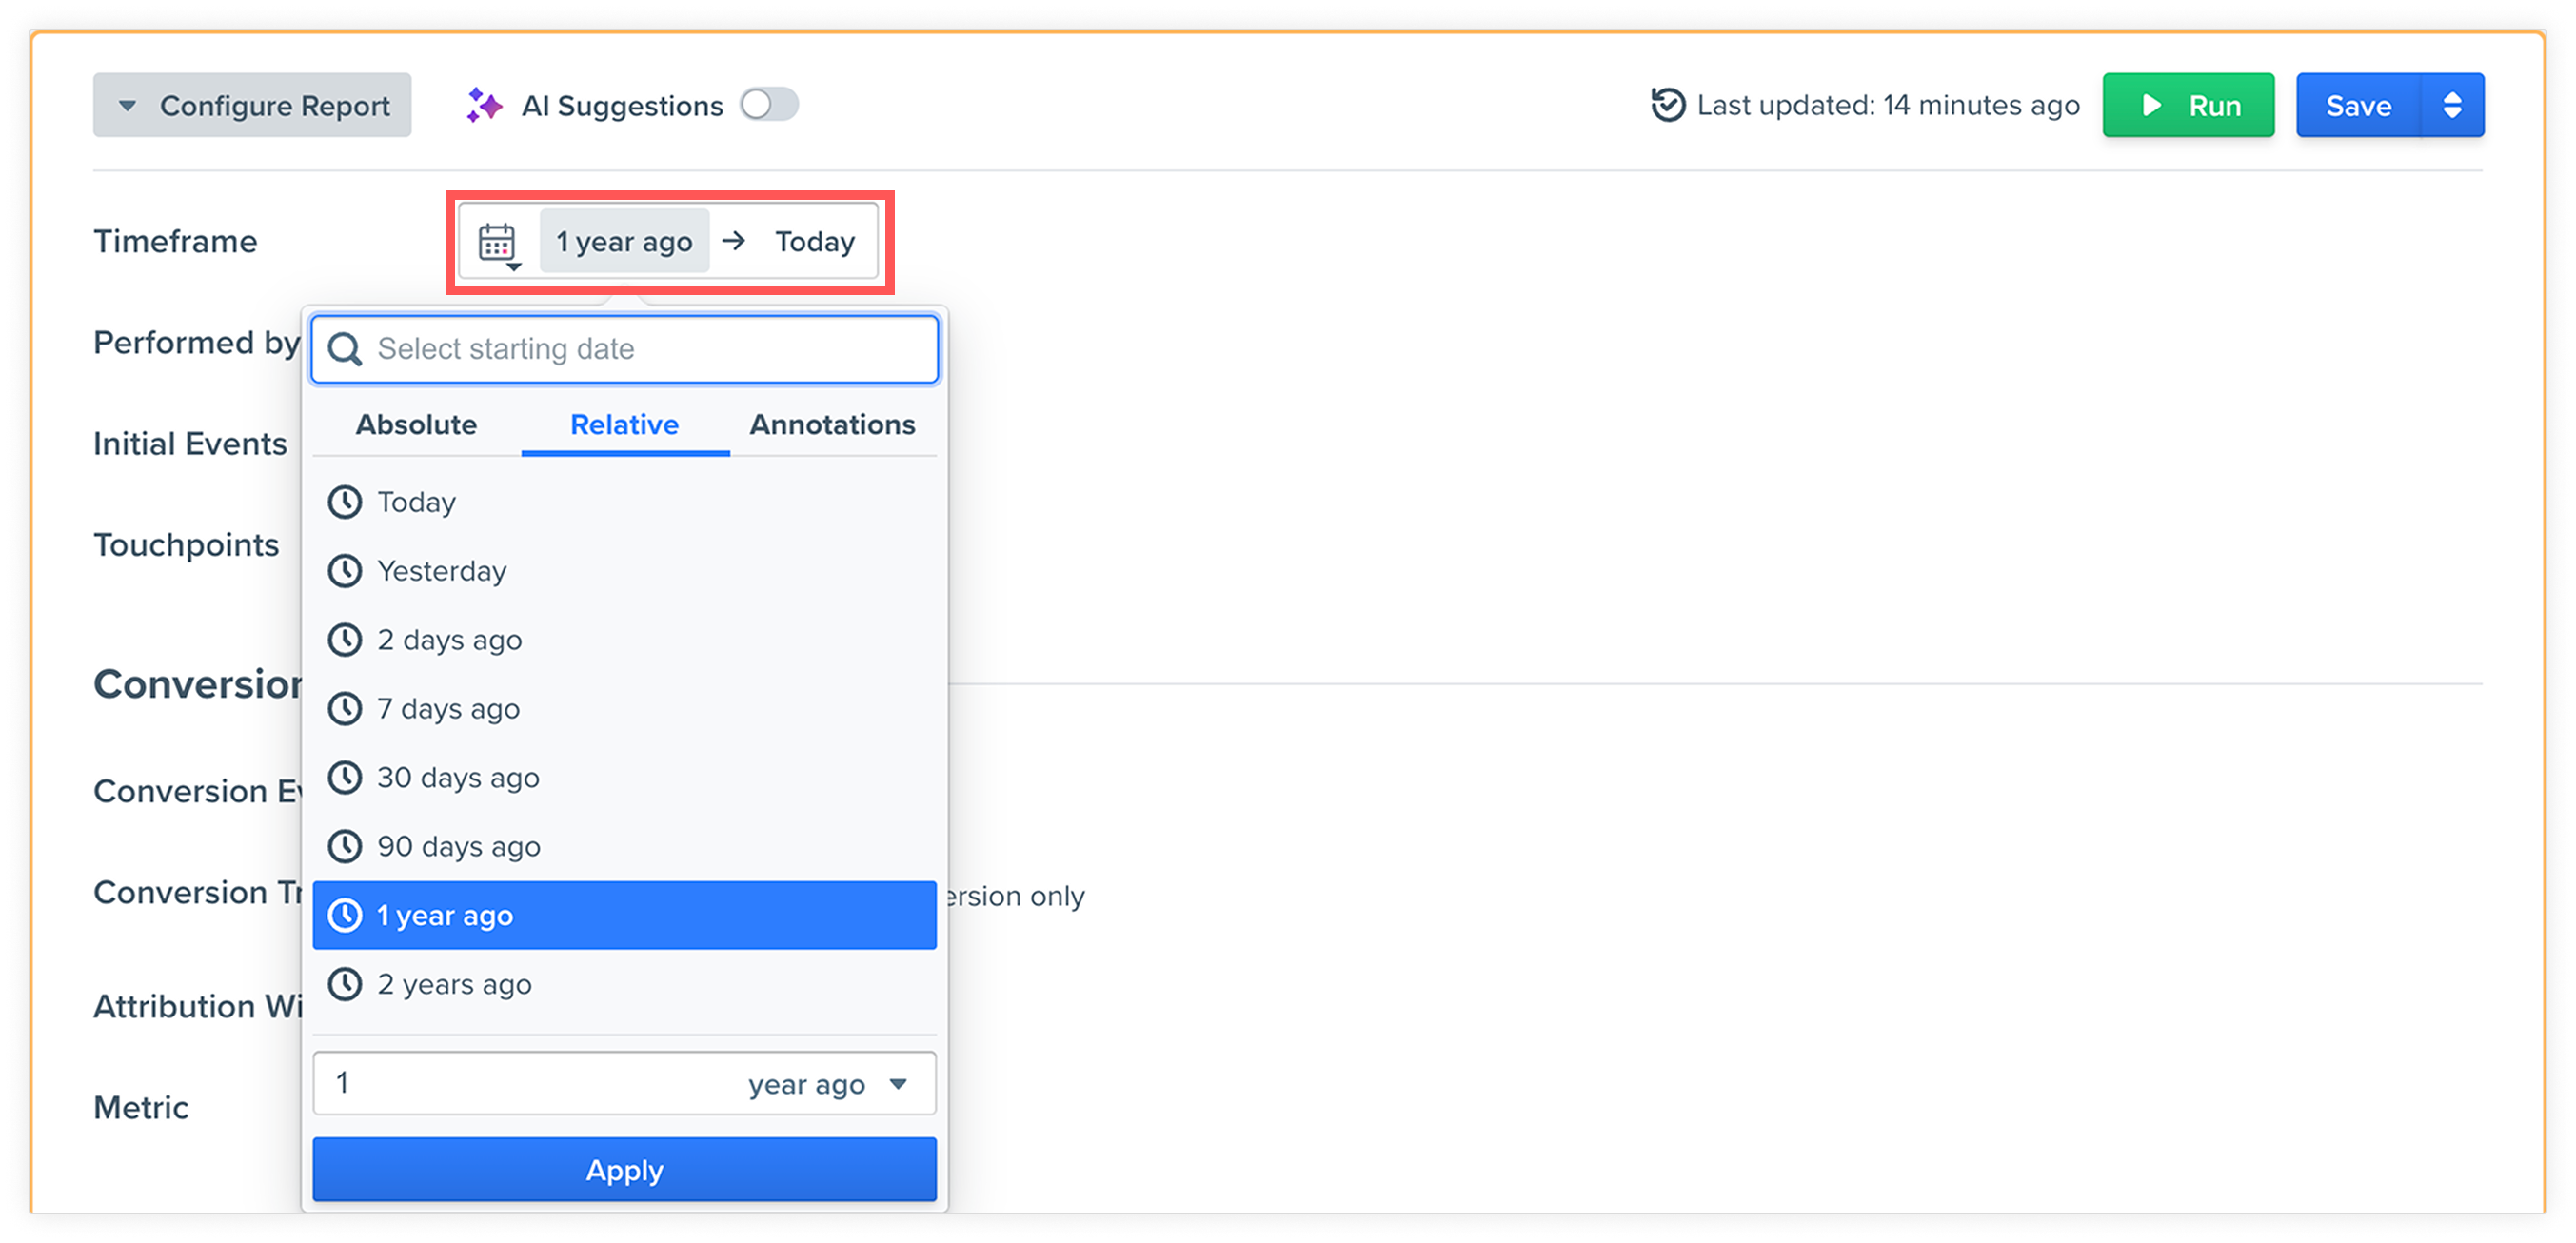
If a user performed at least one event in the specified timeframe, their data will be included in this report. In this example, we’ve selected 1 year ago.
Performed by
Determines the segment or group of people you'll be analyzing. In this example, we would like to analyze all users in the database, so we’ll select All users.
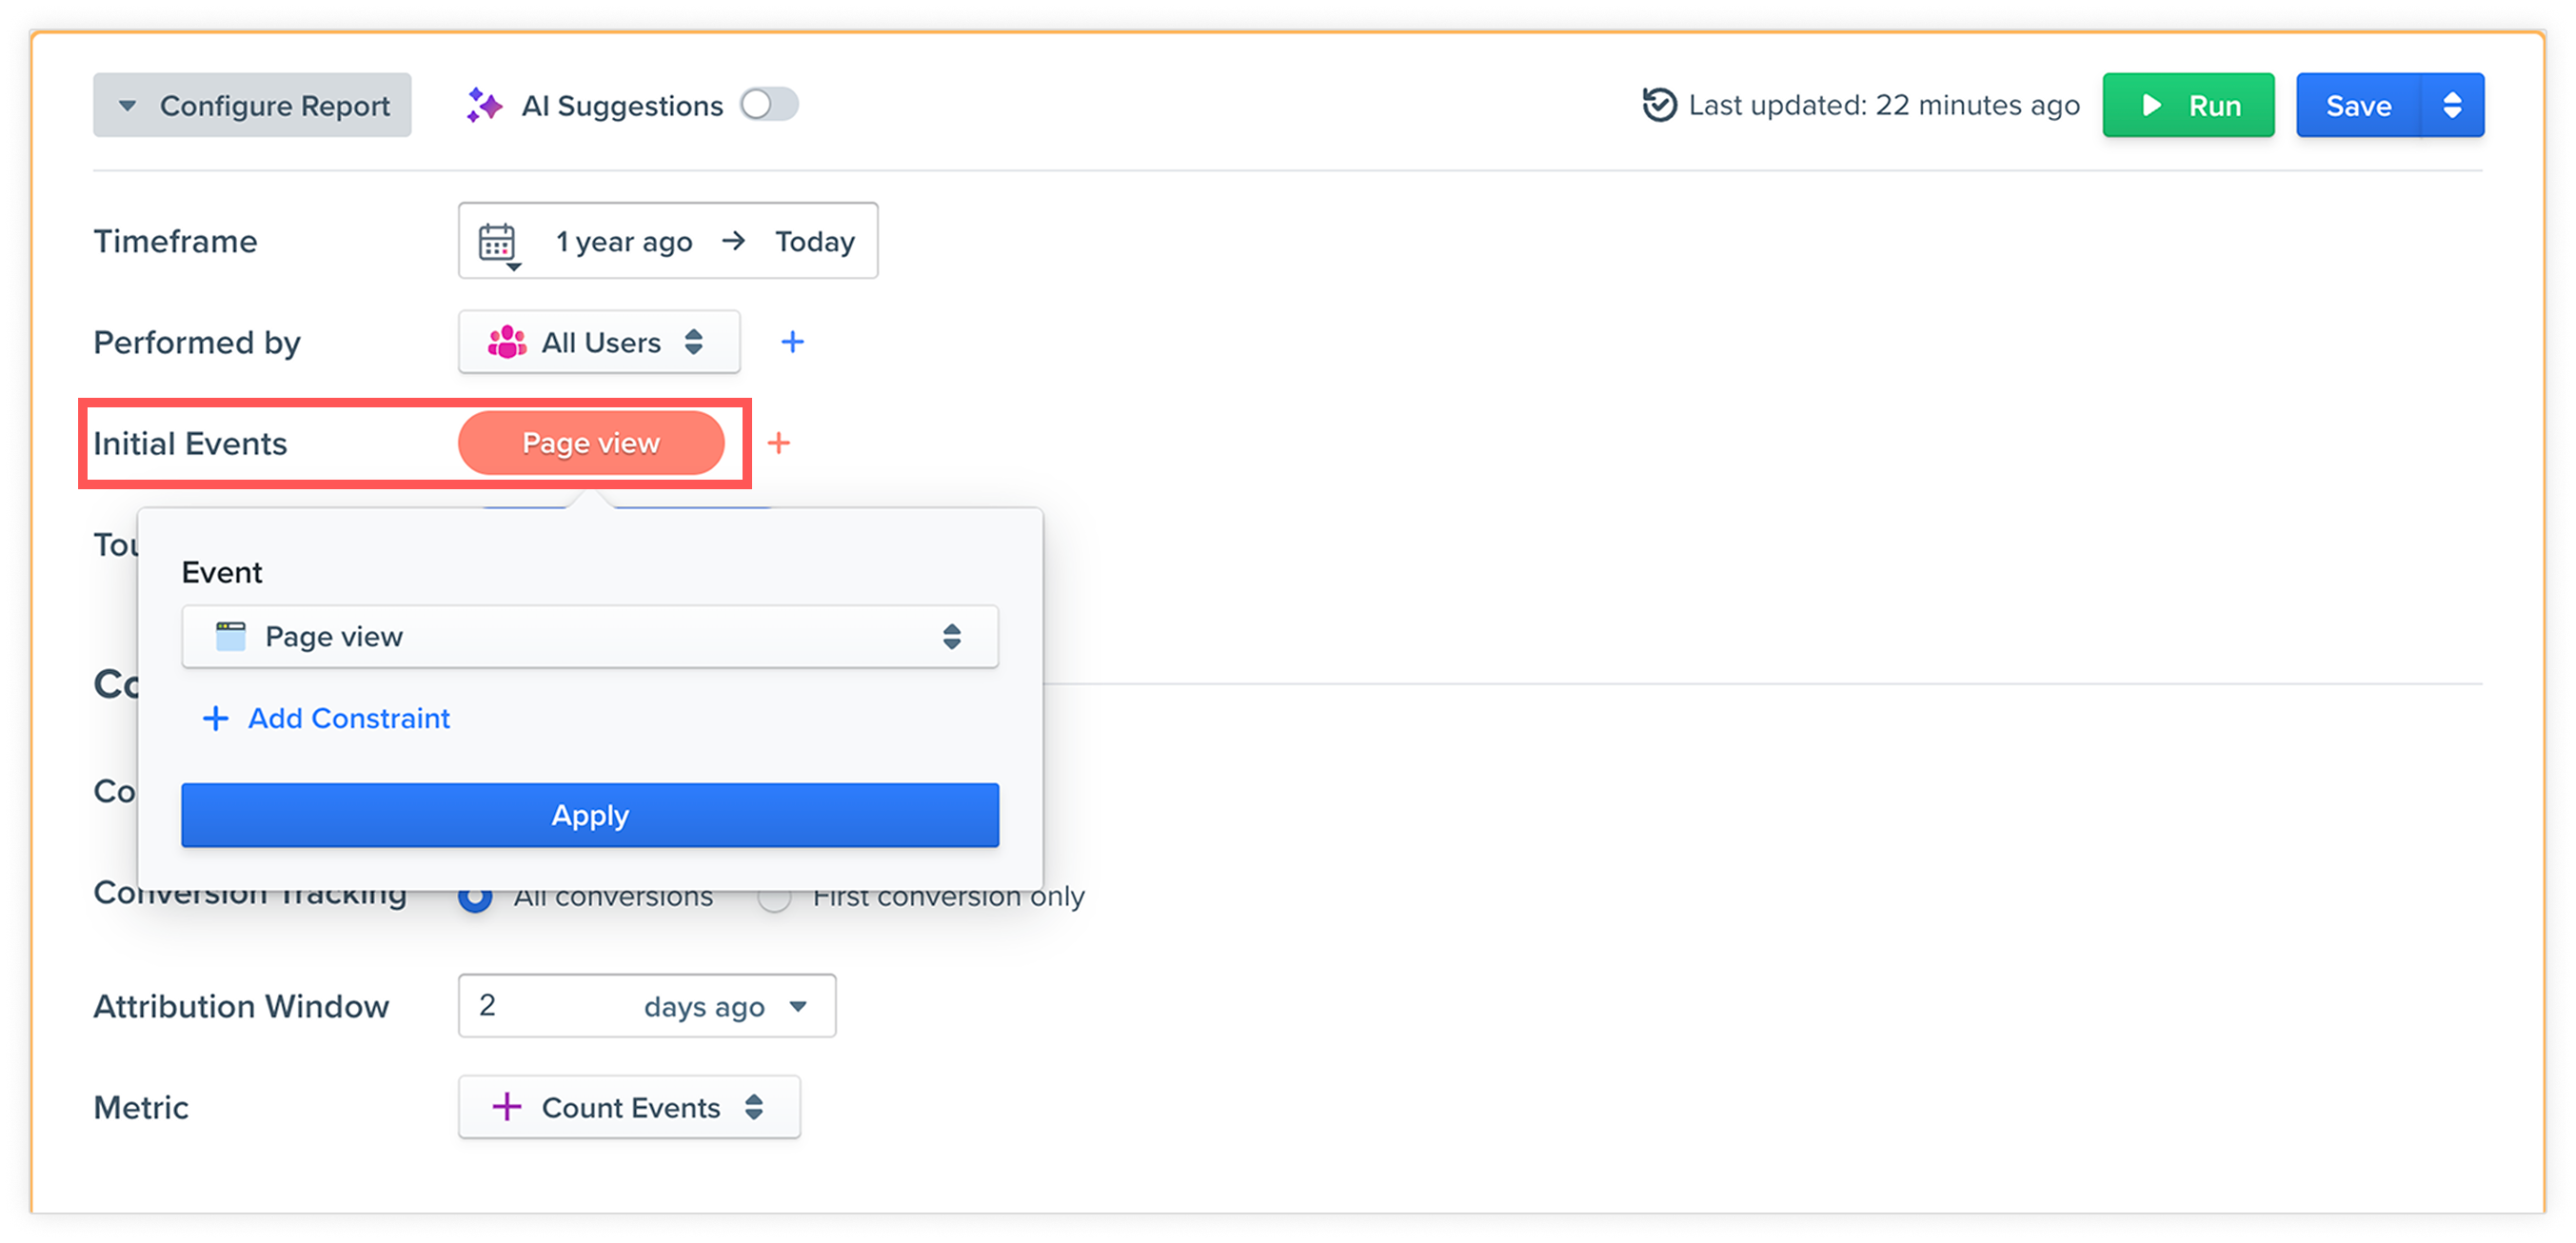
Initial Events
Select the first event (or starting point) where you want the attribution analysis to begin within the selected timeframe.
In this example, we would like to include all the users who have ever viewed any page on the website (for example, all the visitors), so we’ll select the Page view event without adding any additional constraints.
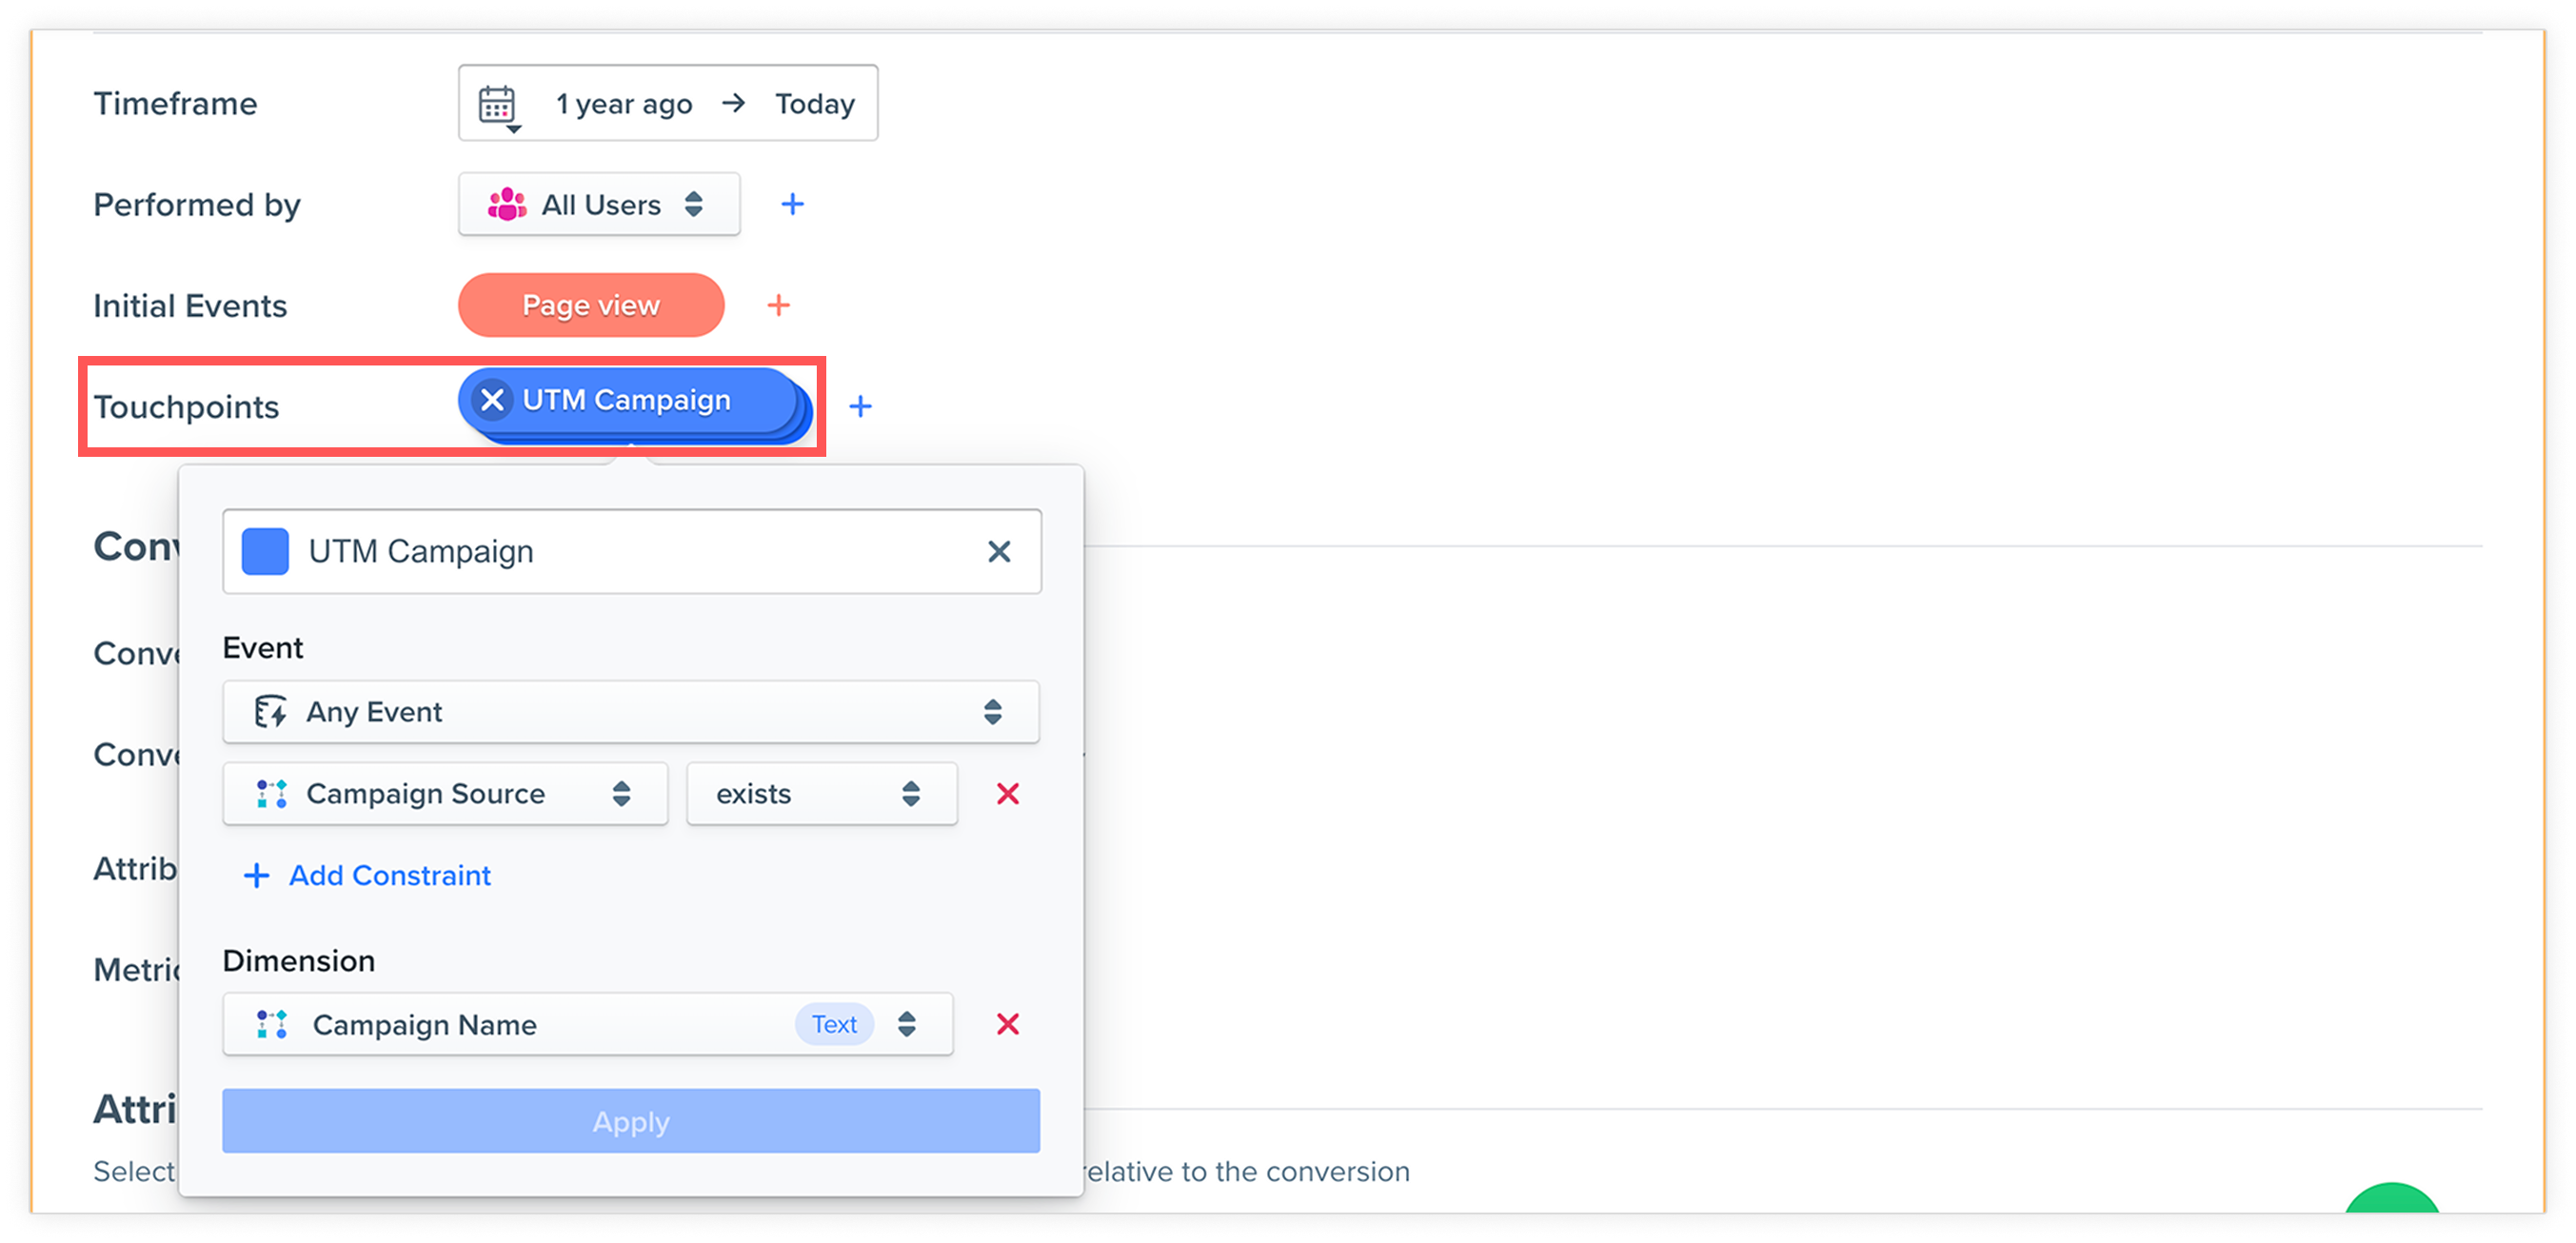
Touchpoints
Touchpoints are the specific attribution events that you want to analyze. In this example, we'd like to analyze the difference between each acquisition channel, so we’ve chosen the UTM campaign as the touchpoint and selected Page view where Campaign Source = exists, where the campaign source is where the ad was displayed, for example, Google, Facebook, Instagram.
The dimension determines how the report is organized. For example, since we’ve selected Campaign Source as the dimension, the report will display an analysis of all the different campaign sources.
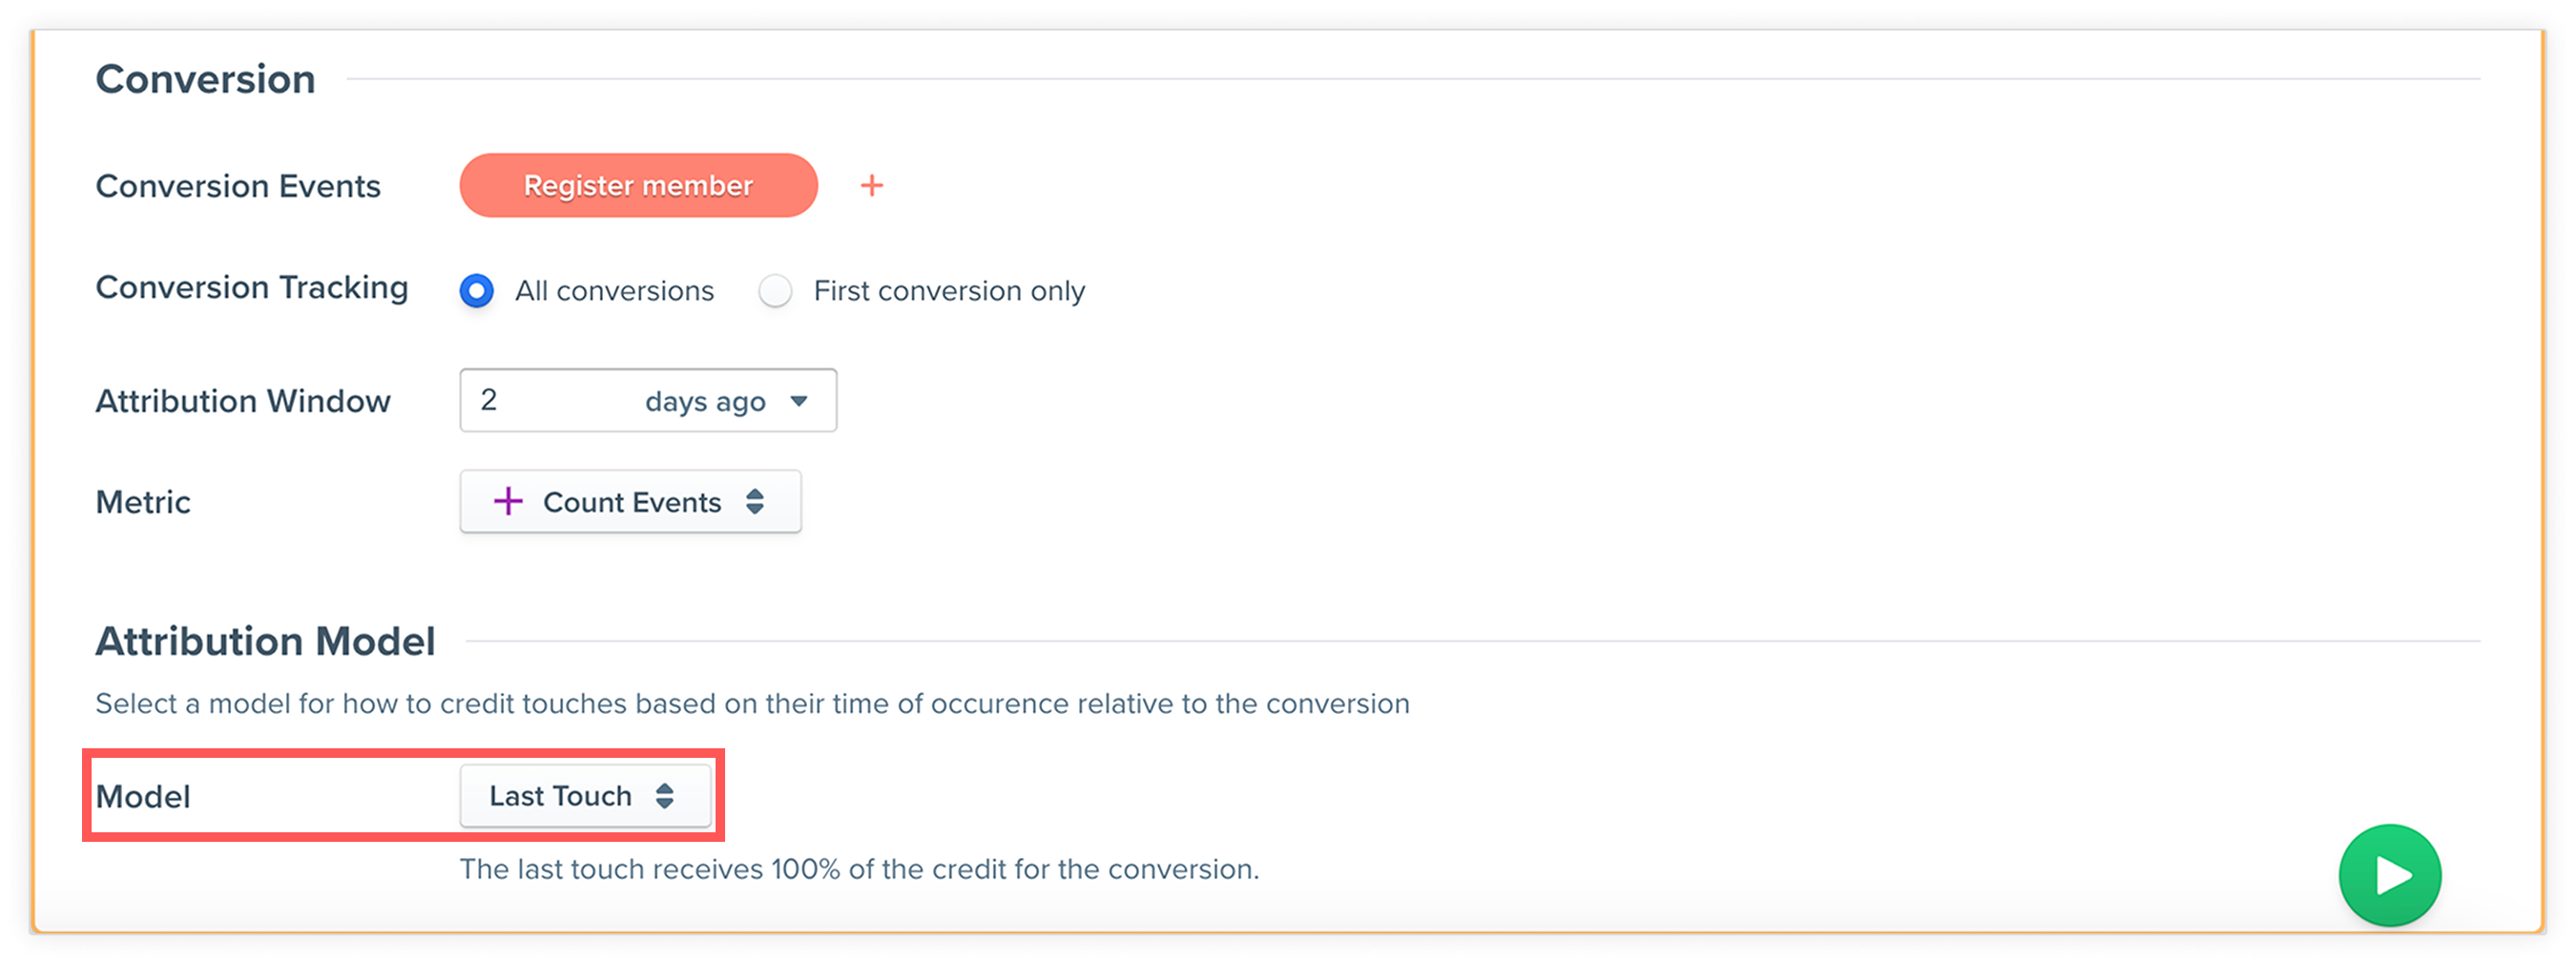
Conversion
This is the conversion event that you want to analyze. In this example, we’ve chosen Register member as the conversion event.
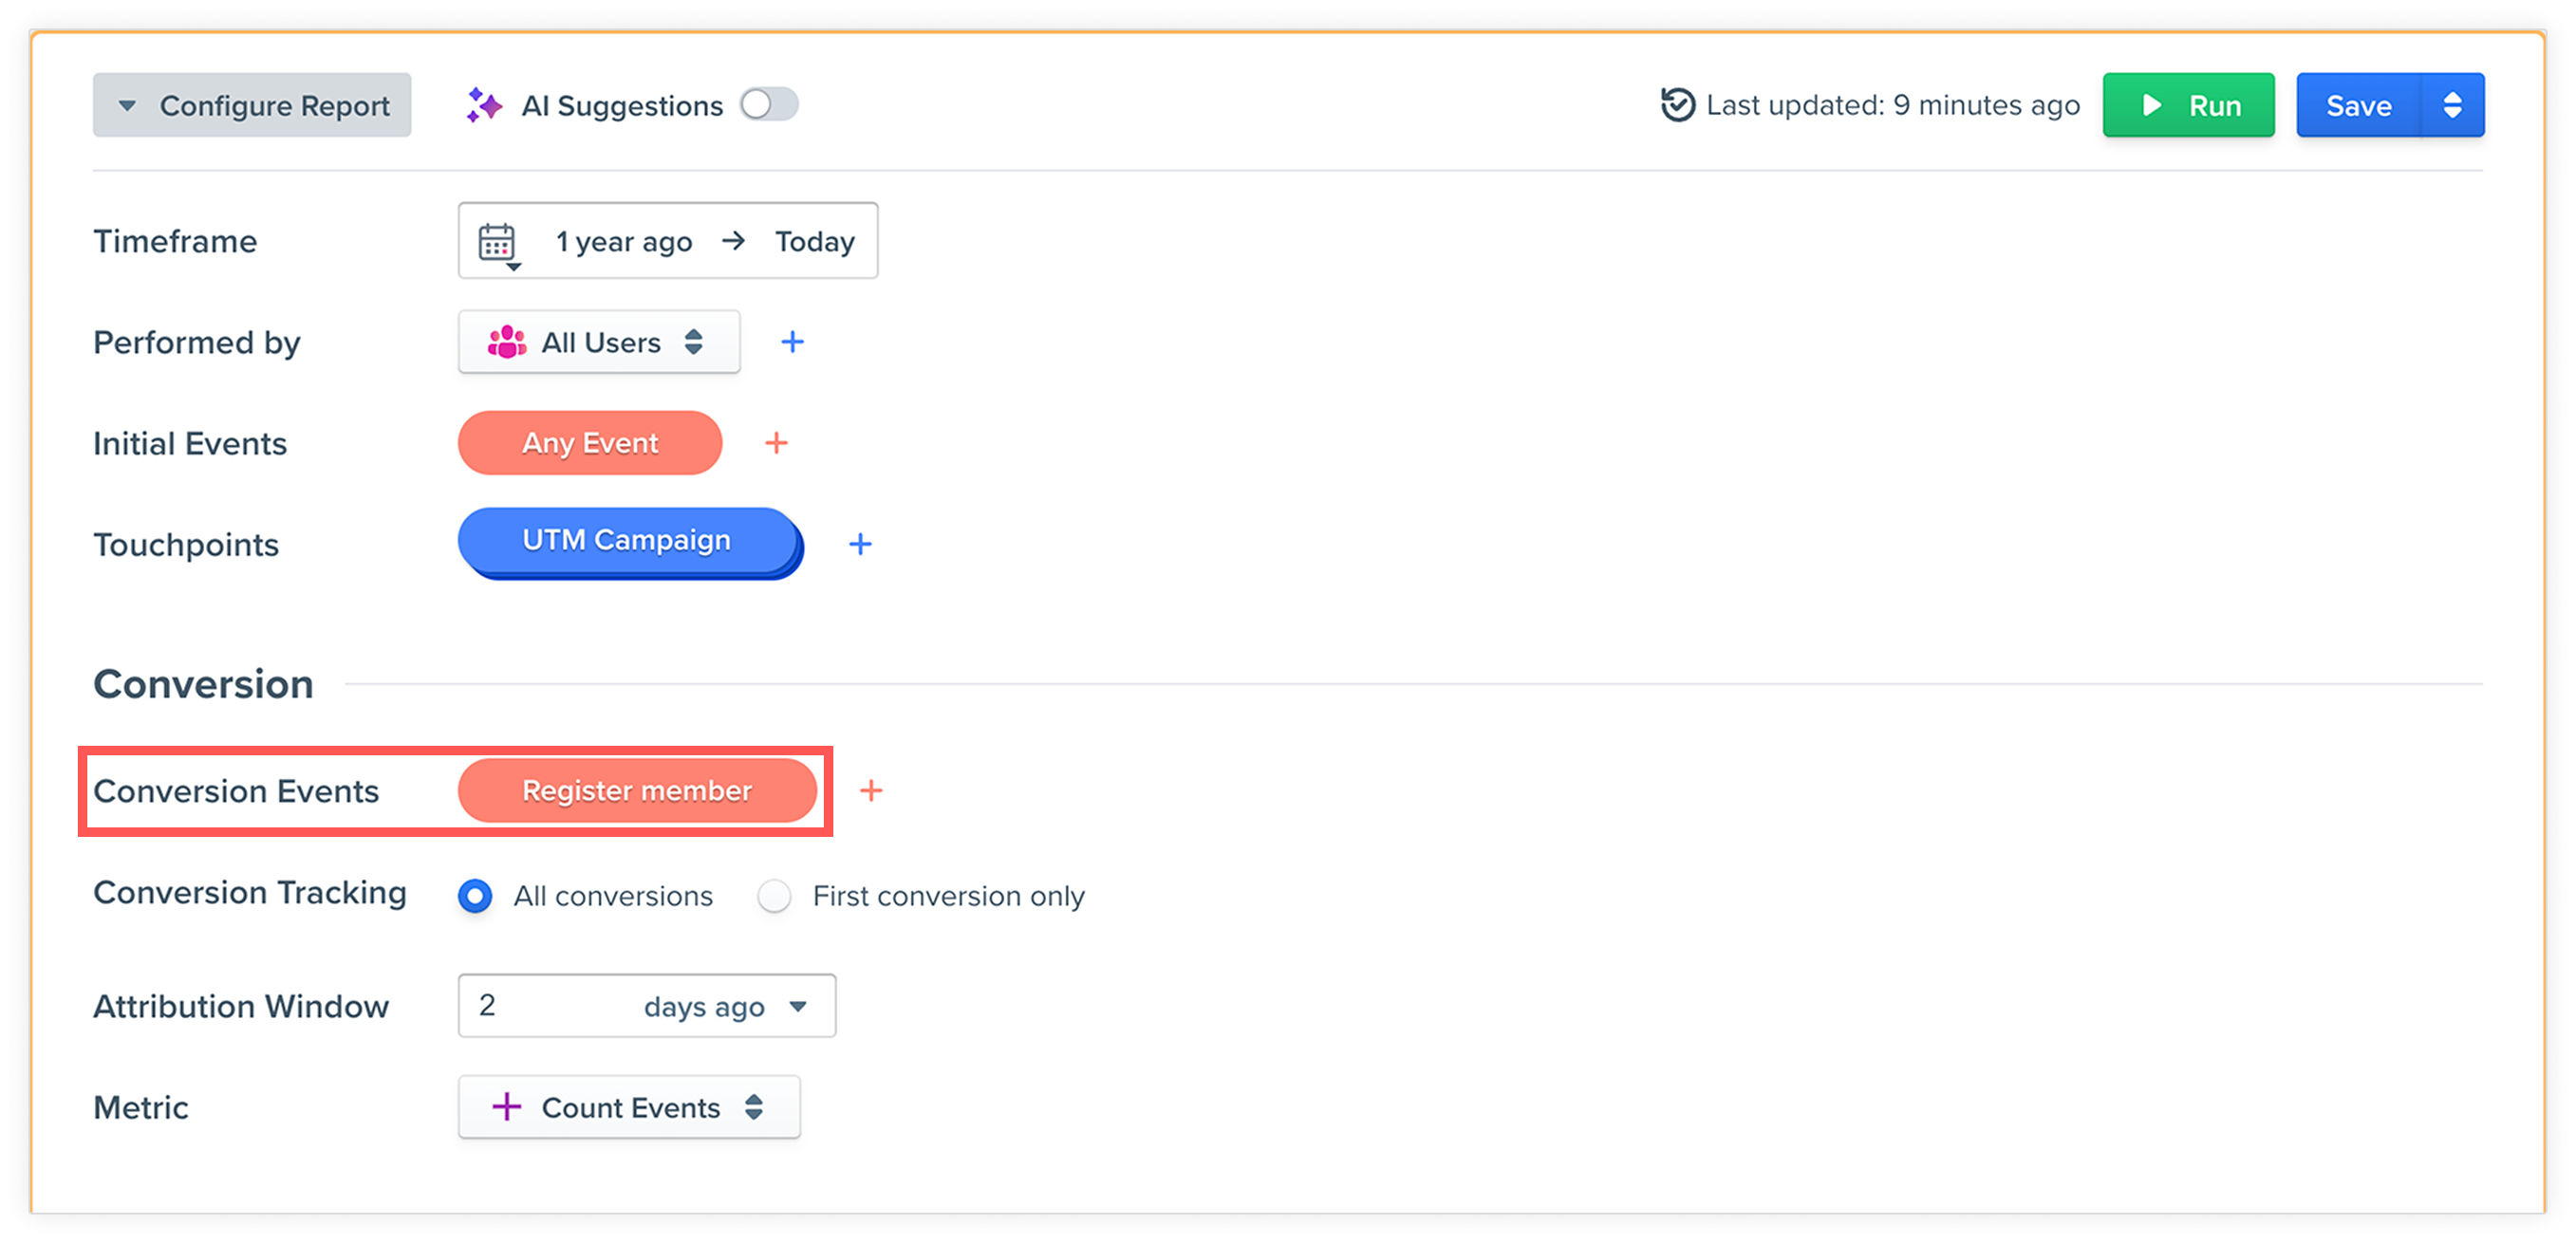
NoteDeveloper assistance will be required to log custom events (for example, “Register member”) using the Appier SDK. To learn more, see Custom Events and Attributes .
3. Select an attribution model
Select the attribution model that you want to use. The model determines how credit is assigned for the conversion.
In this example, we’ve selected Last Touch, where the last touchpoint receives 100% of the credit for the conversion.
AttributionTo learn more about the available attribution models, refer to Attribution report guide .
4. Run the report
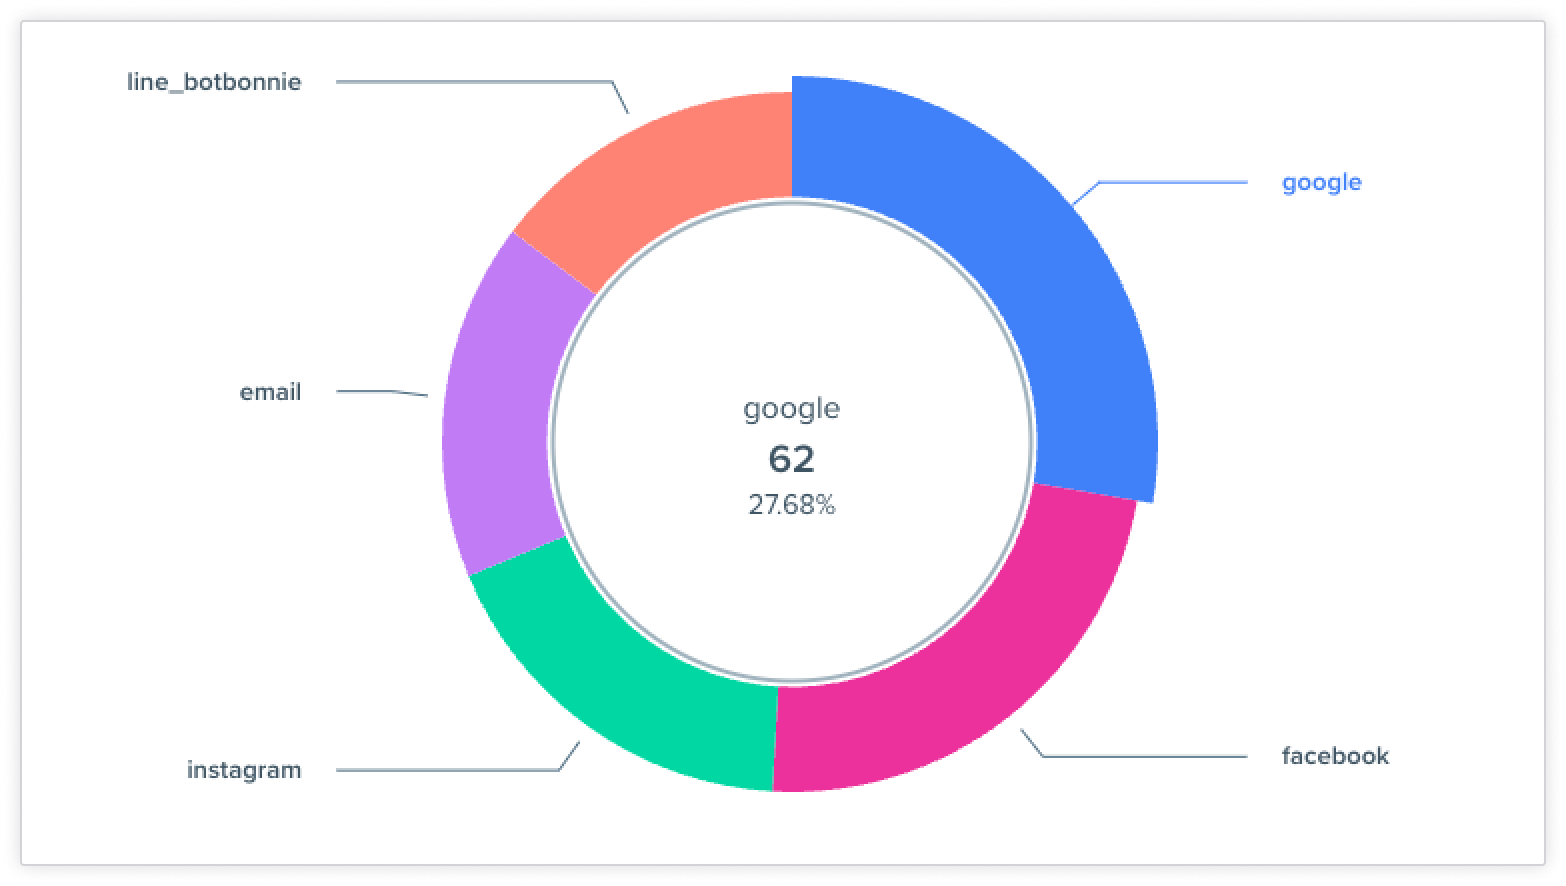
We can see in the report that among all the 224 conversions, google was the highest-performing campaign channel, resulting in 62 conversions—meaning users registered as members.
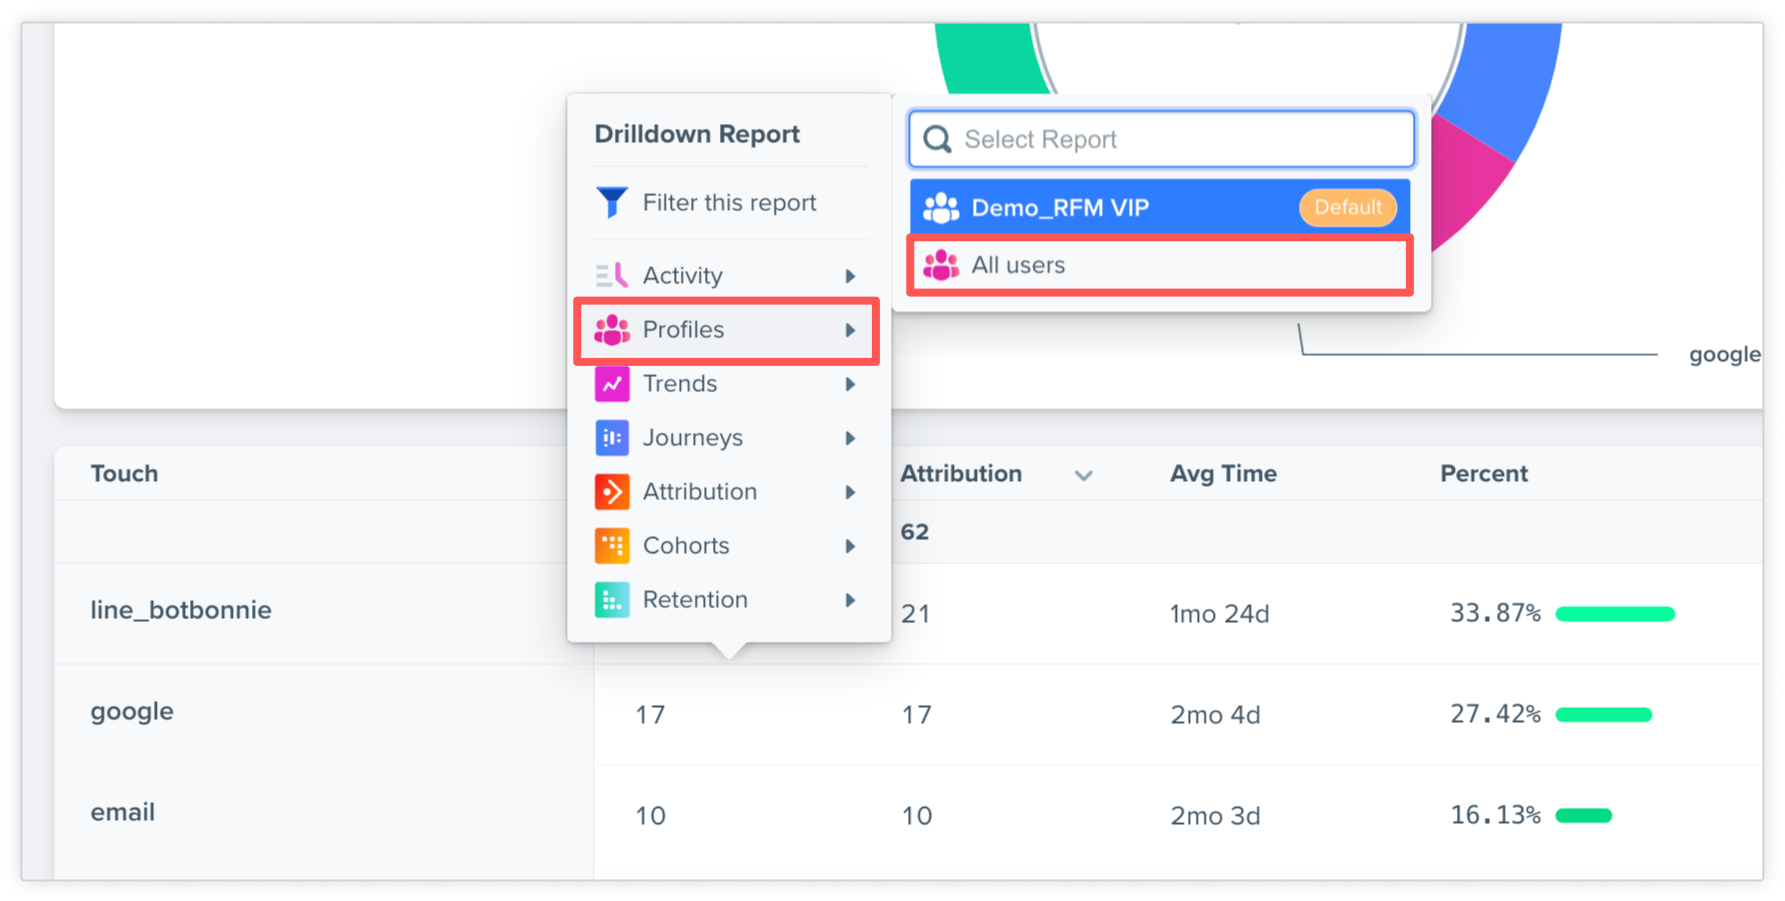
The report also indicates the average time taken from the initial event (page viewed) to conversion (registered as a member). Interestingly, the data reveals that the LINE channel boasts the shortest conversion time from viewer to member.
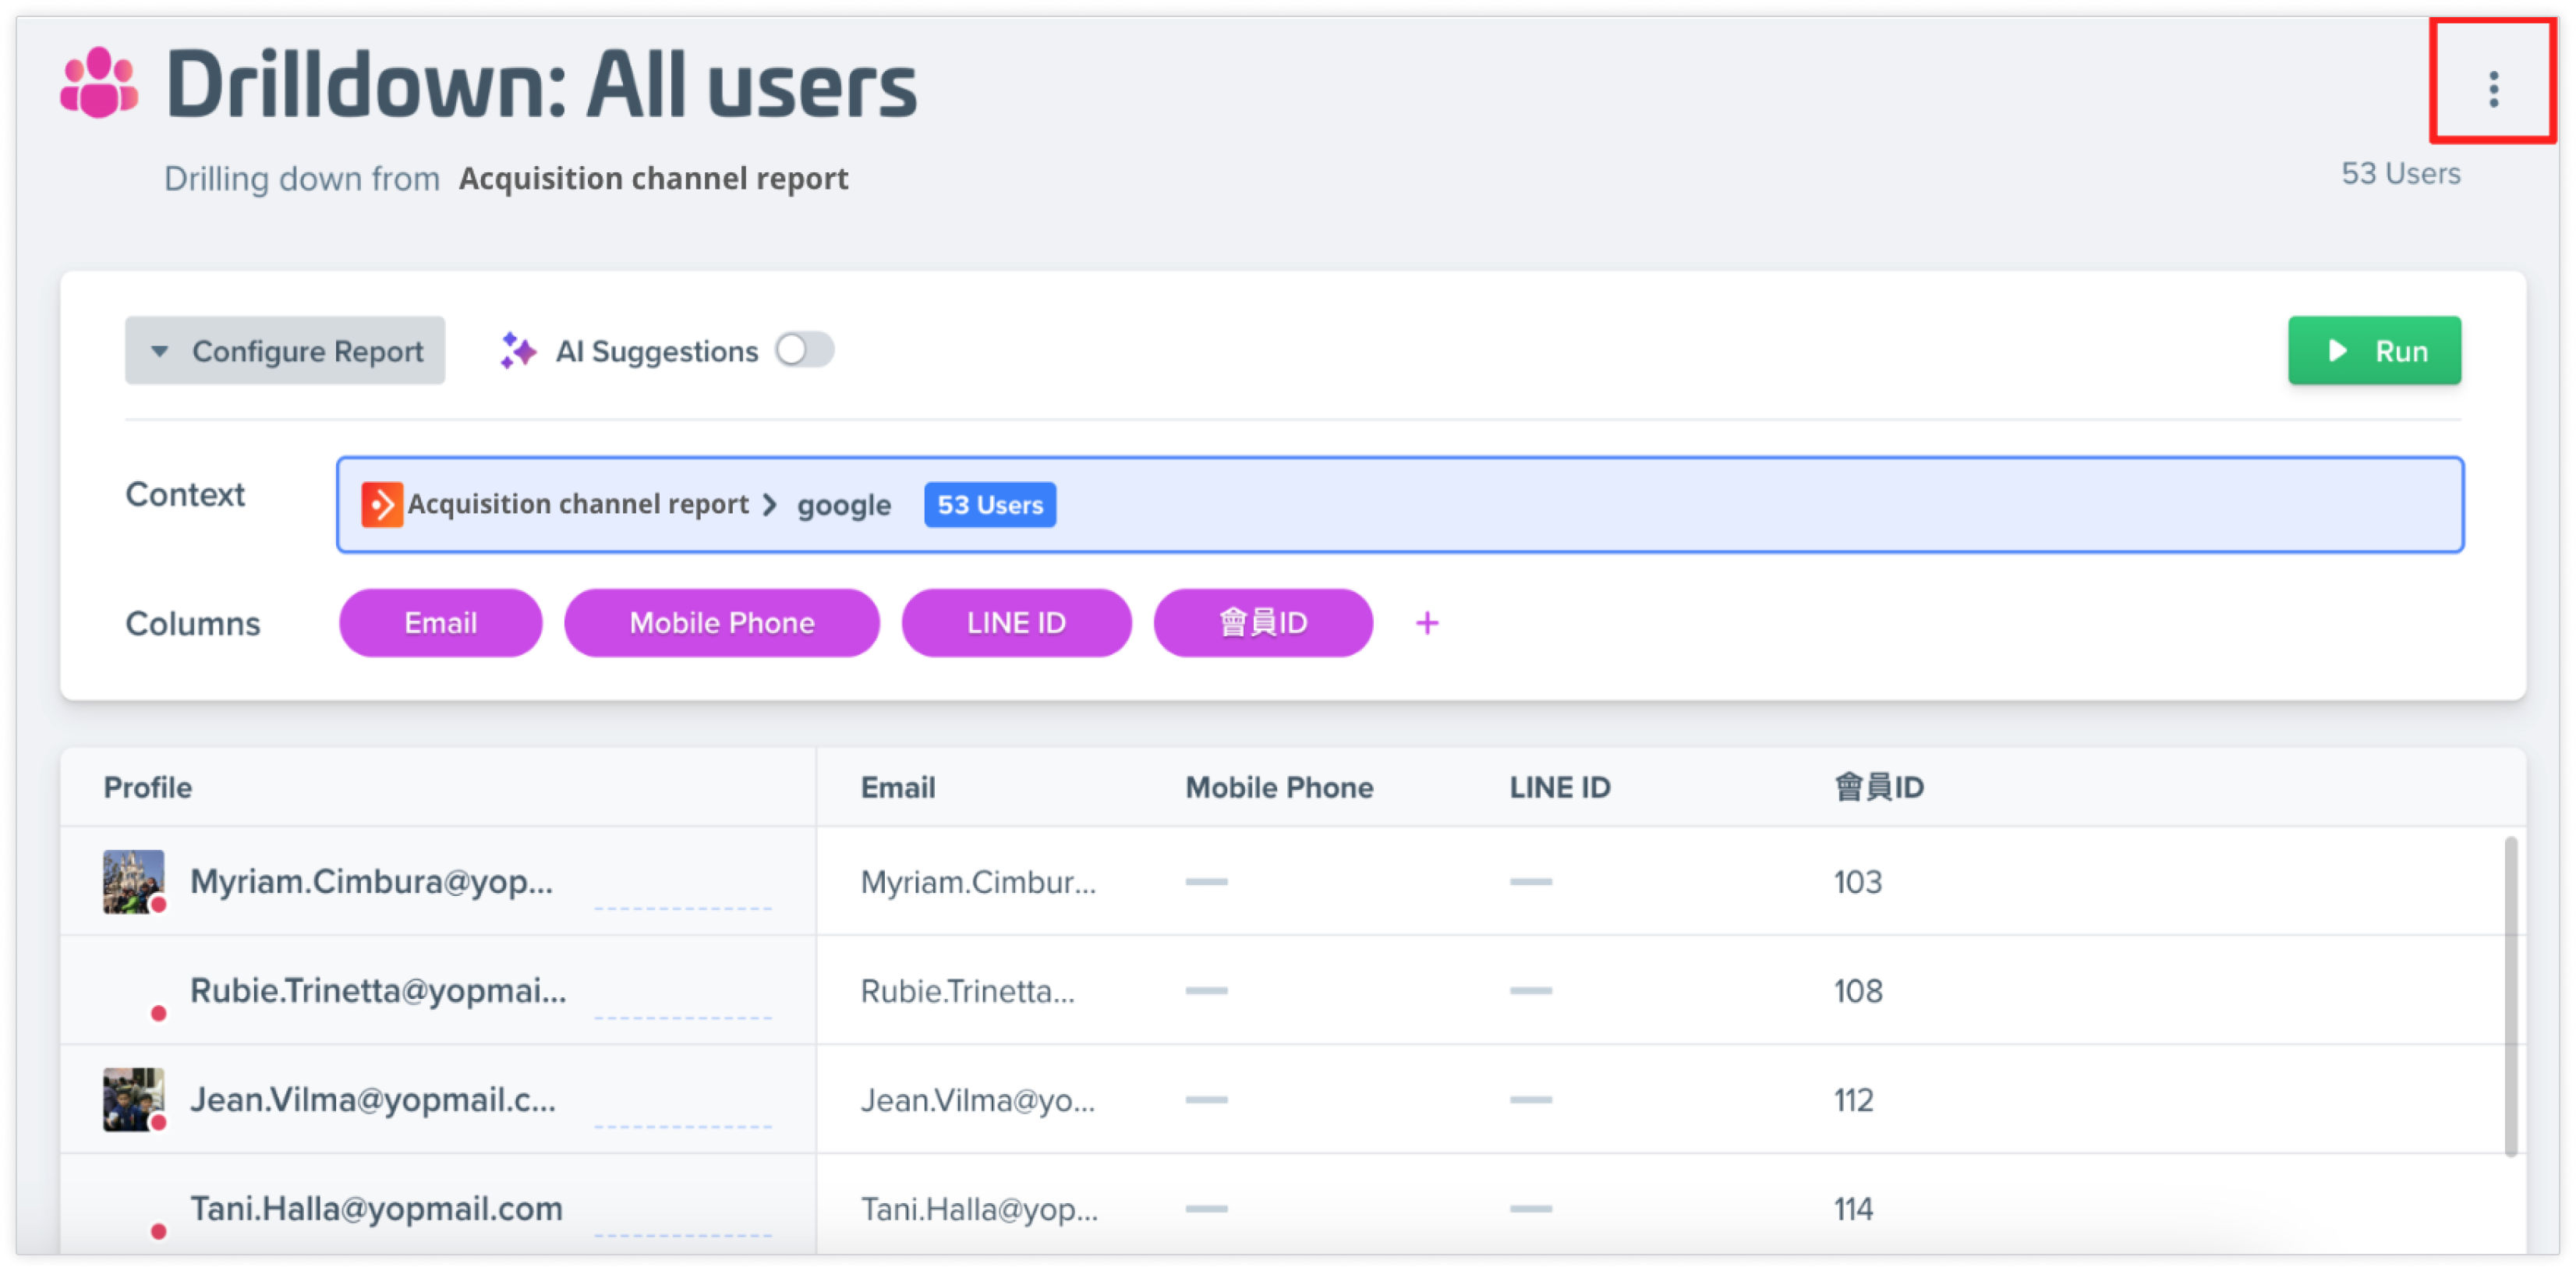
5. Create a drilldown report for user profiles
You can also create a profile report containing users that satisfy a filter, for example, filtering by conversion channel.
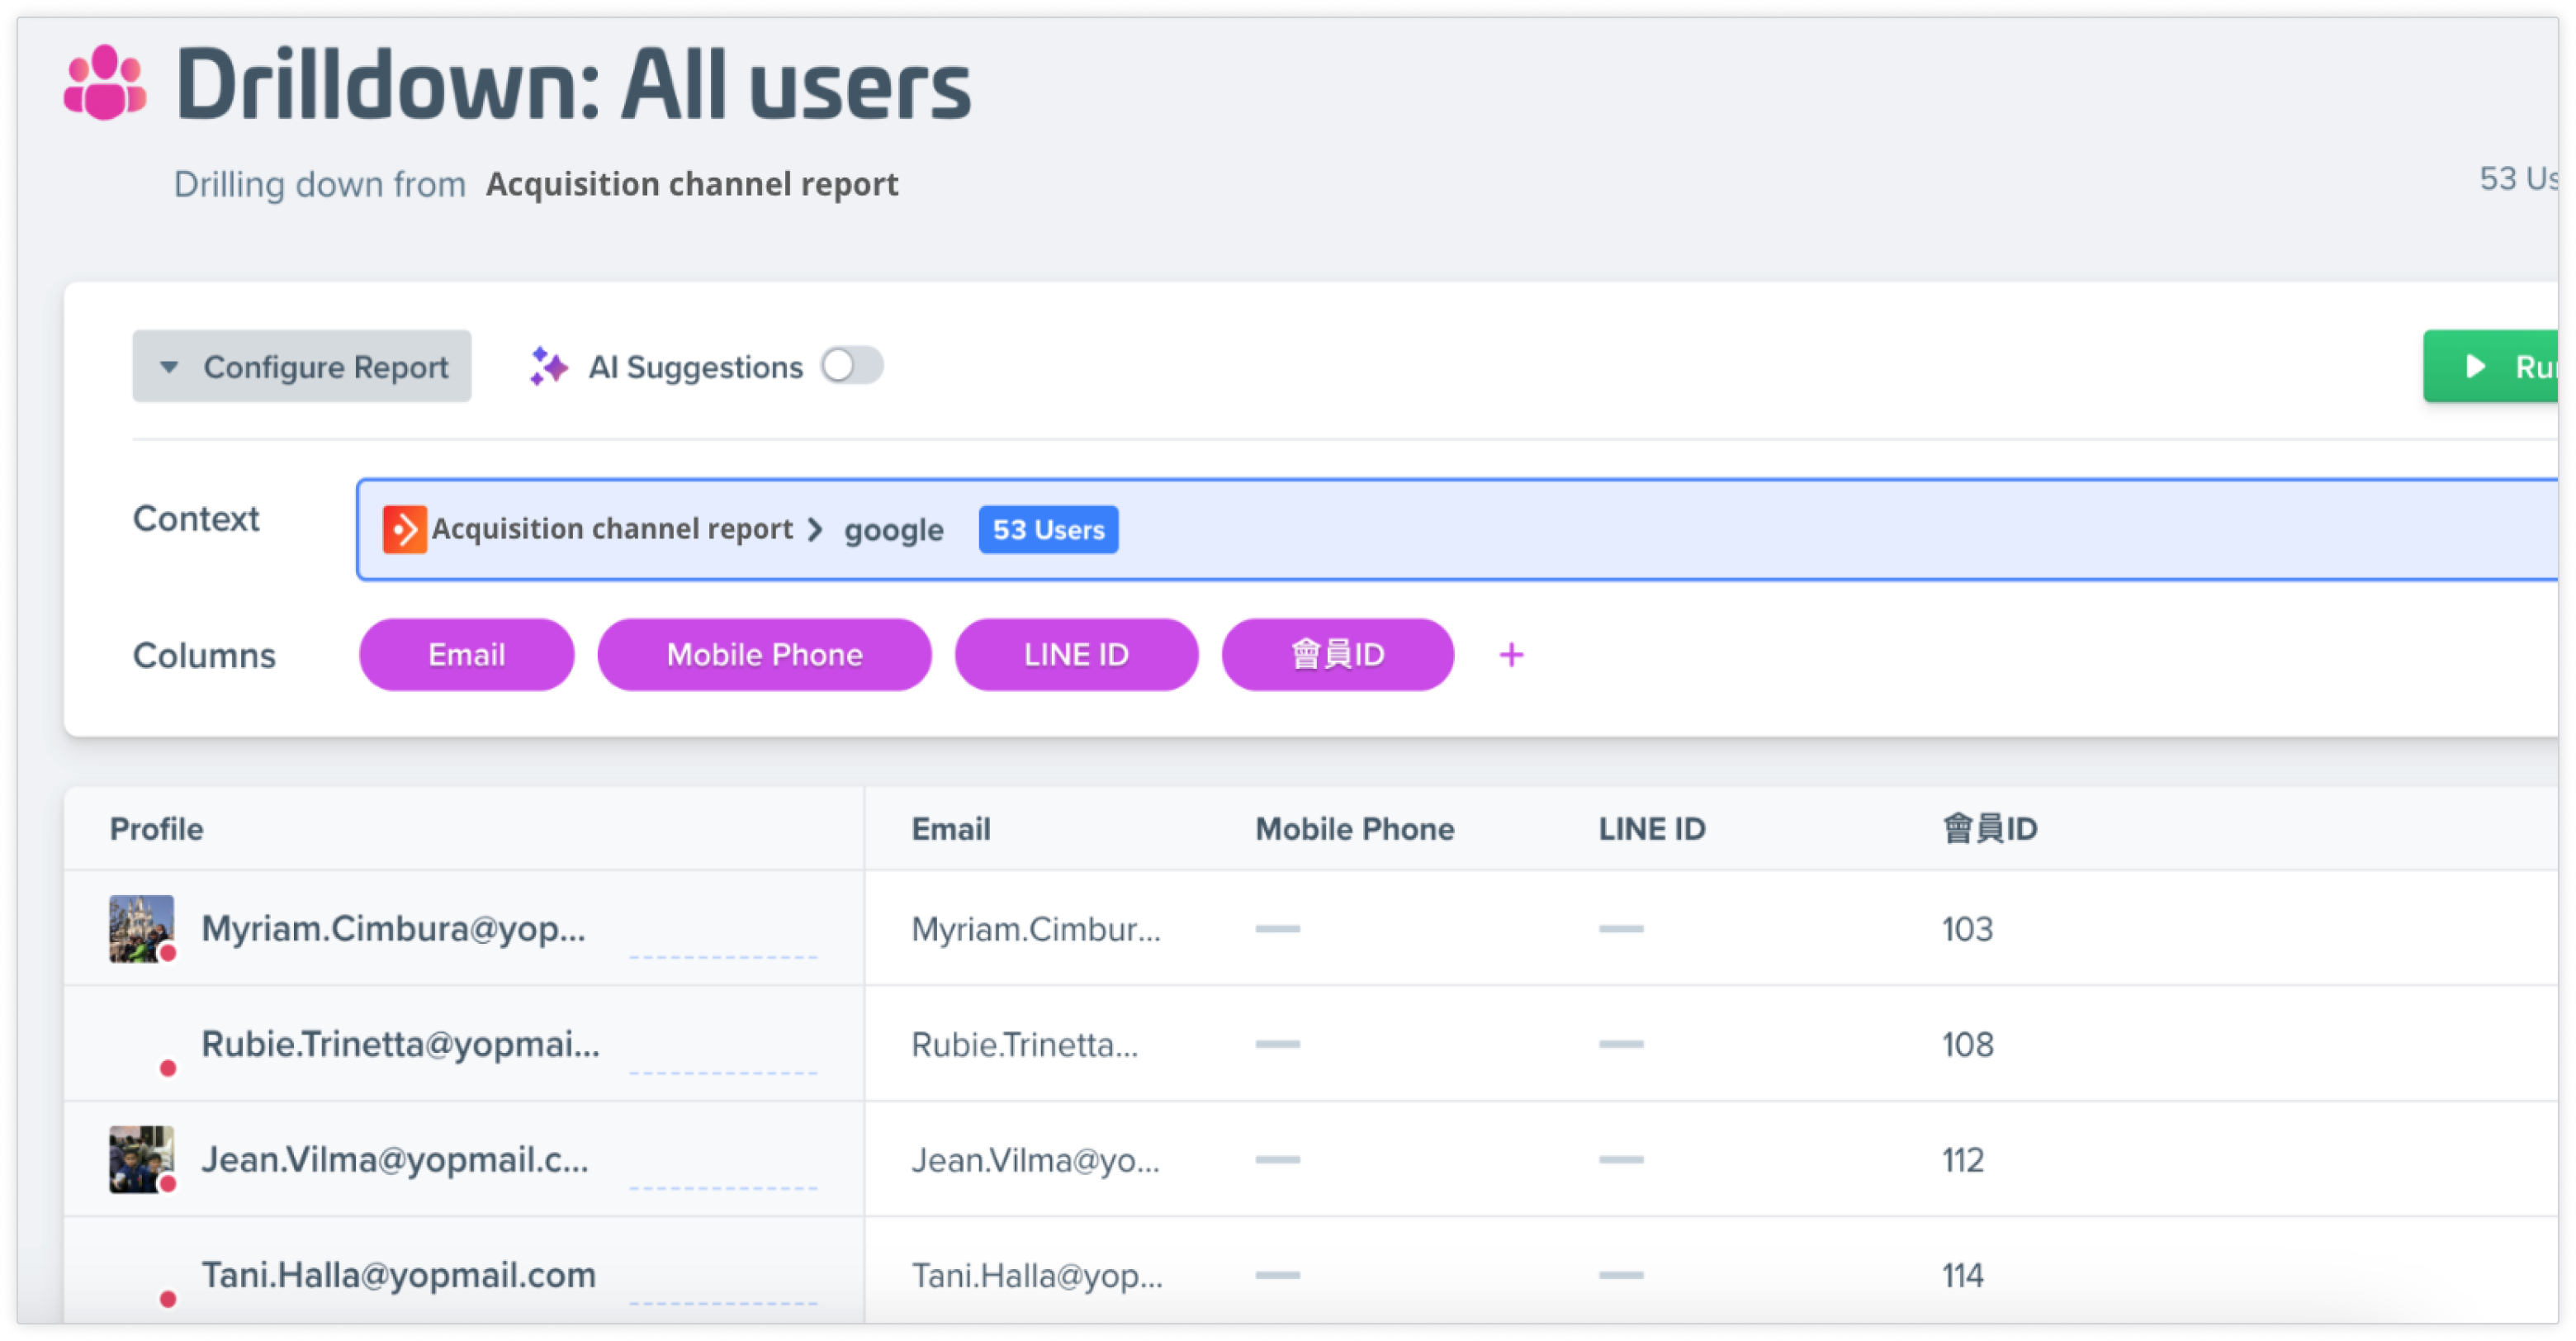
In this example, we’ll select all the 53 users converted from the Google channel by hovering over the cell corresponding to users who converted from Google, and clicking the filter icon. In the generated drilldown report, you can view the profiles of the 53 users who converted from Google.
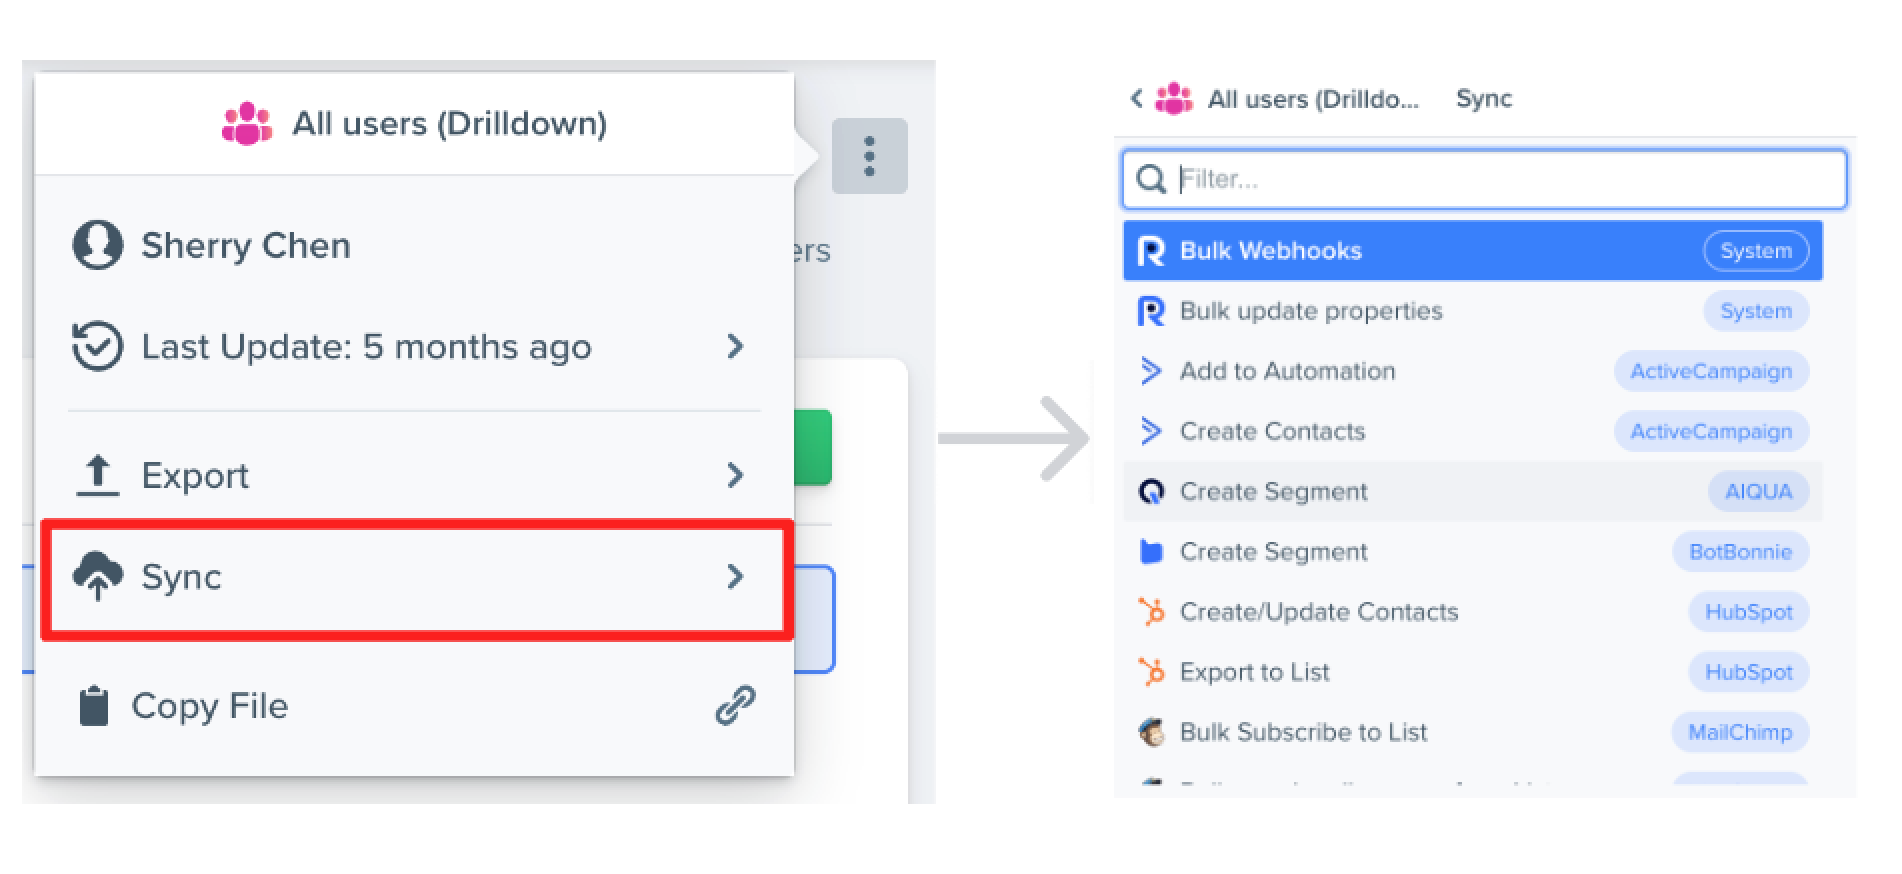
6. Sync user profiles to a third-party platform for retargeting
To sync the profiles in the report to a third-party platform, click the three vertical dots in the top right corner of the drilldown report, click Sync, then select the integration you’d like to use.
For example, to create segments on AIQUA for retargeting campaigns, click Create Segment (AIQUA).
Updated over 1 year ago