Journey Performance and Analytics
After a journey has started running, you can see the performance and analytics of the journey map. Refer to the sections below.
NoteMetrics related to Offline conversions appear only if your journey includes offline events. By default, these columns remain hidden until you publish a journey with offline events enabled.
Journey overview
You can click the journey to see how the users move through the journey under the Journey overview tab.
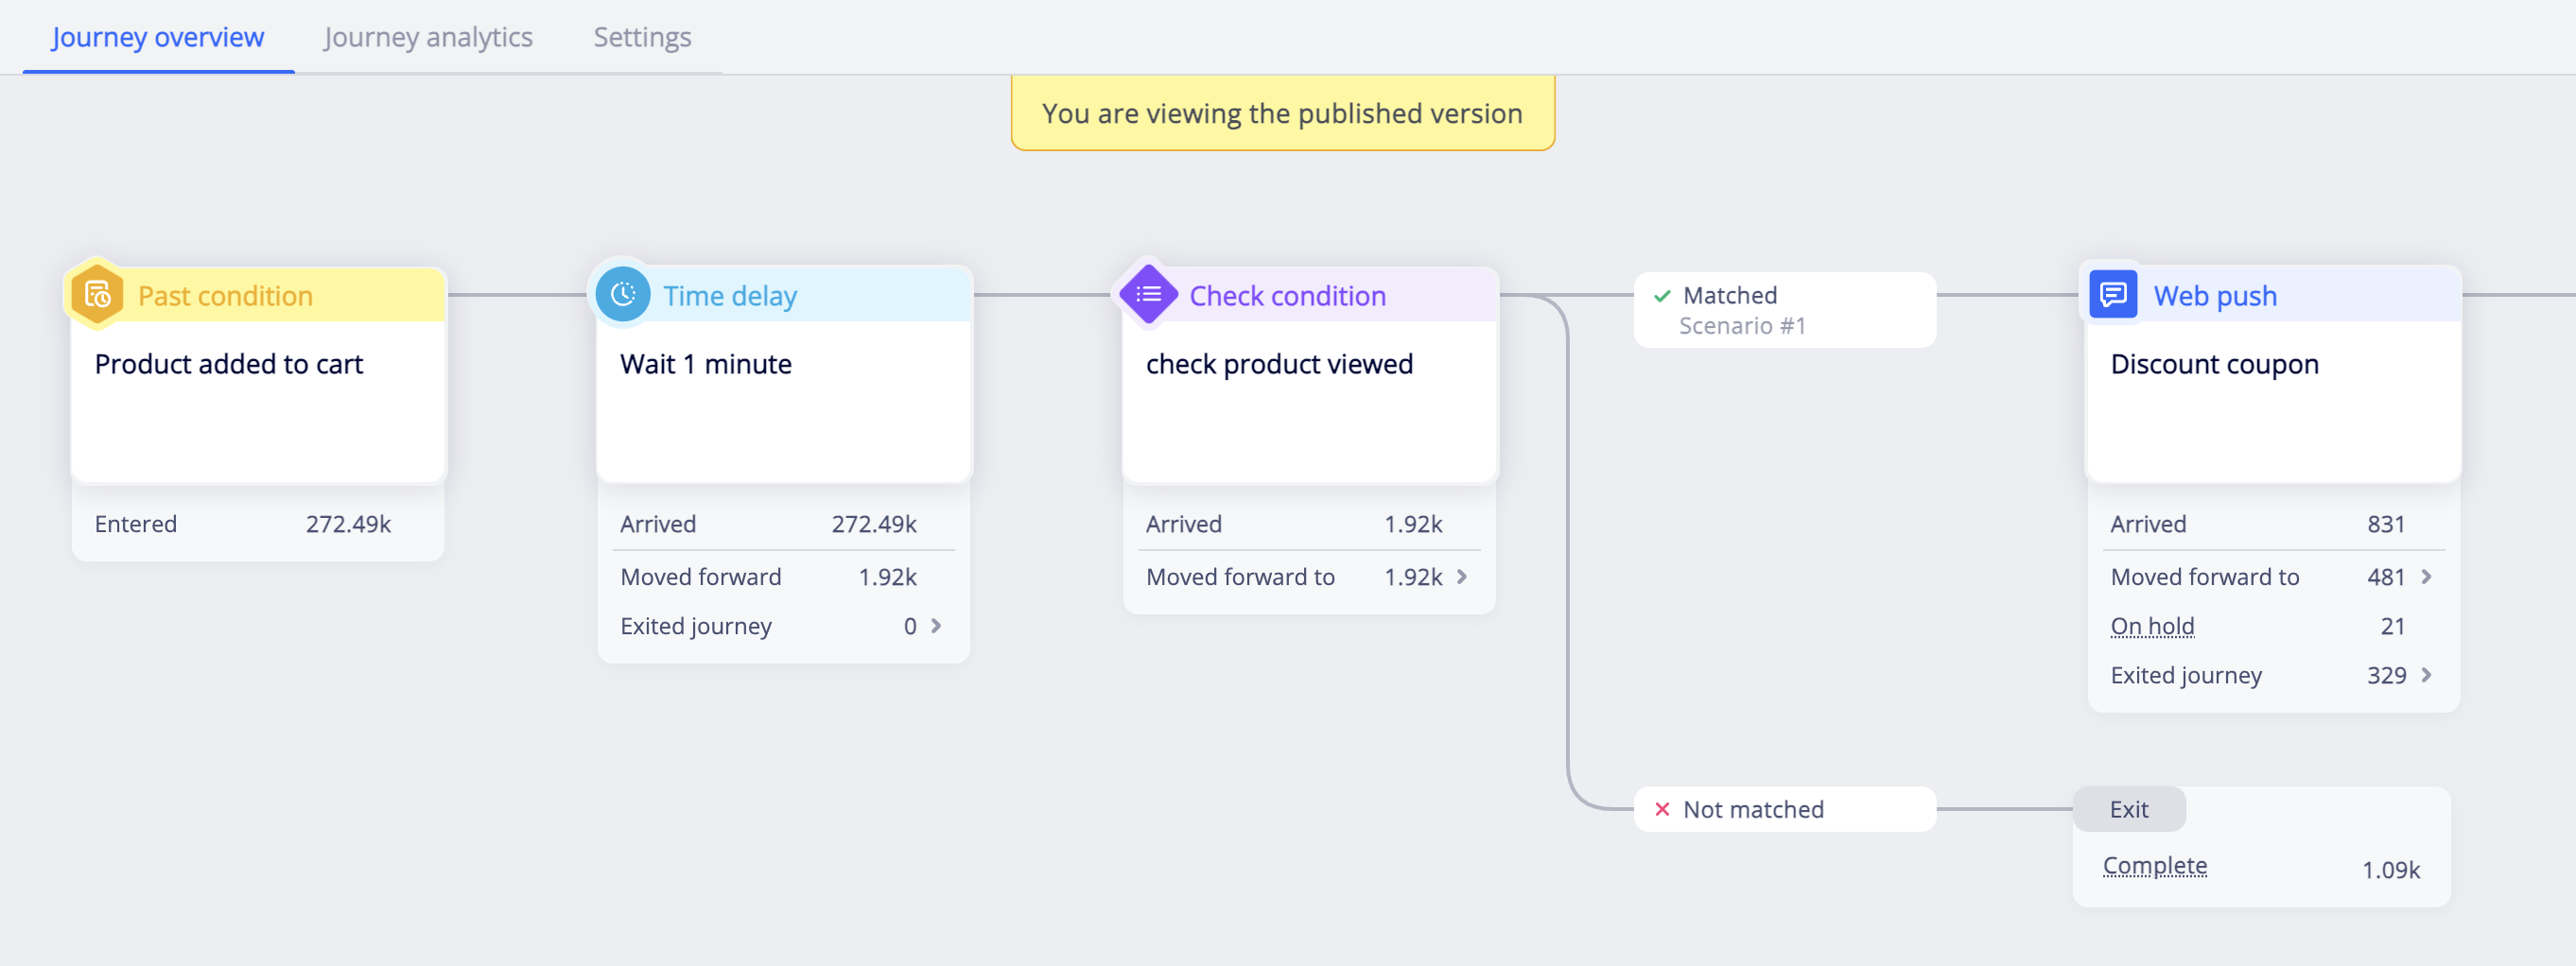
Under the nodes, the following metrics are available:
- Entered: The number of users who met the trigger condition and started the journey by entering the entry node. Re-entered users are counted each time they enter. If journey events are enabled for your account, a
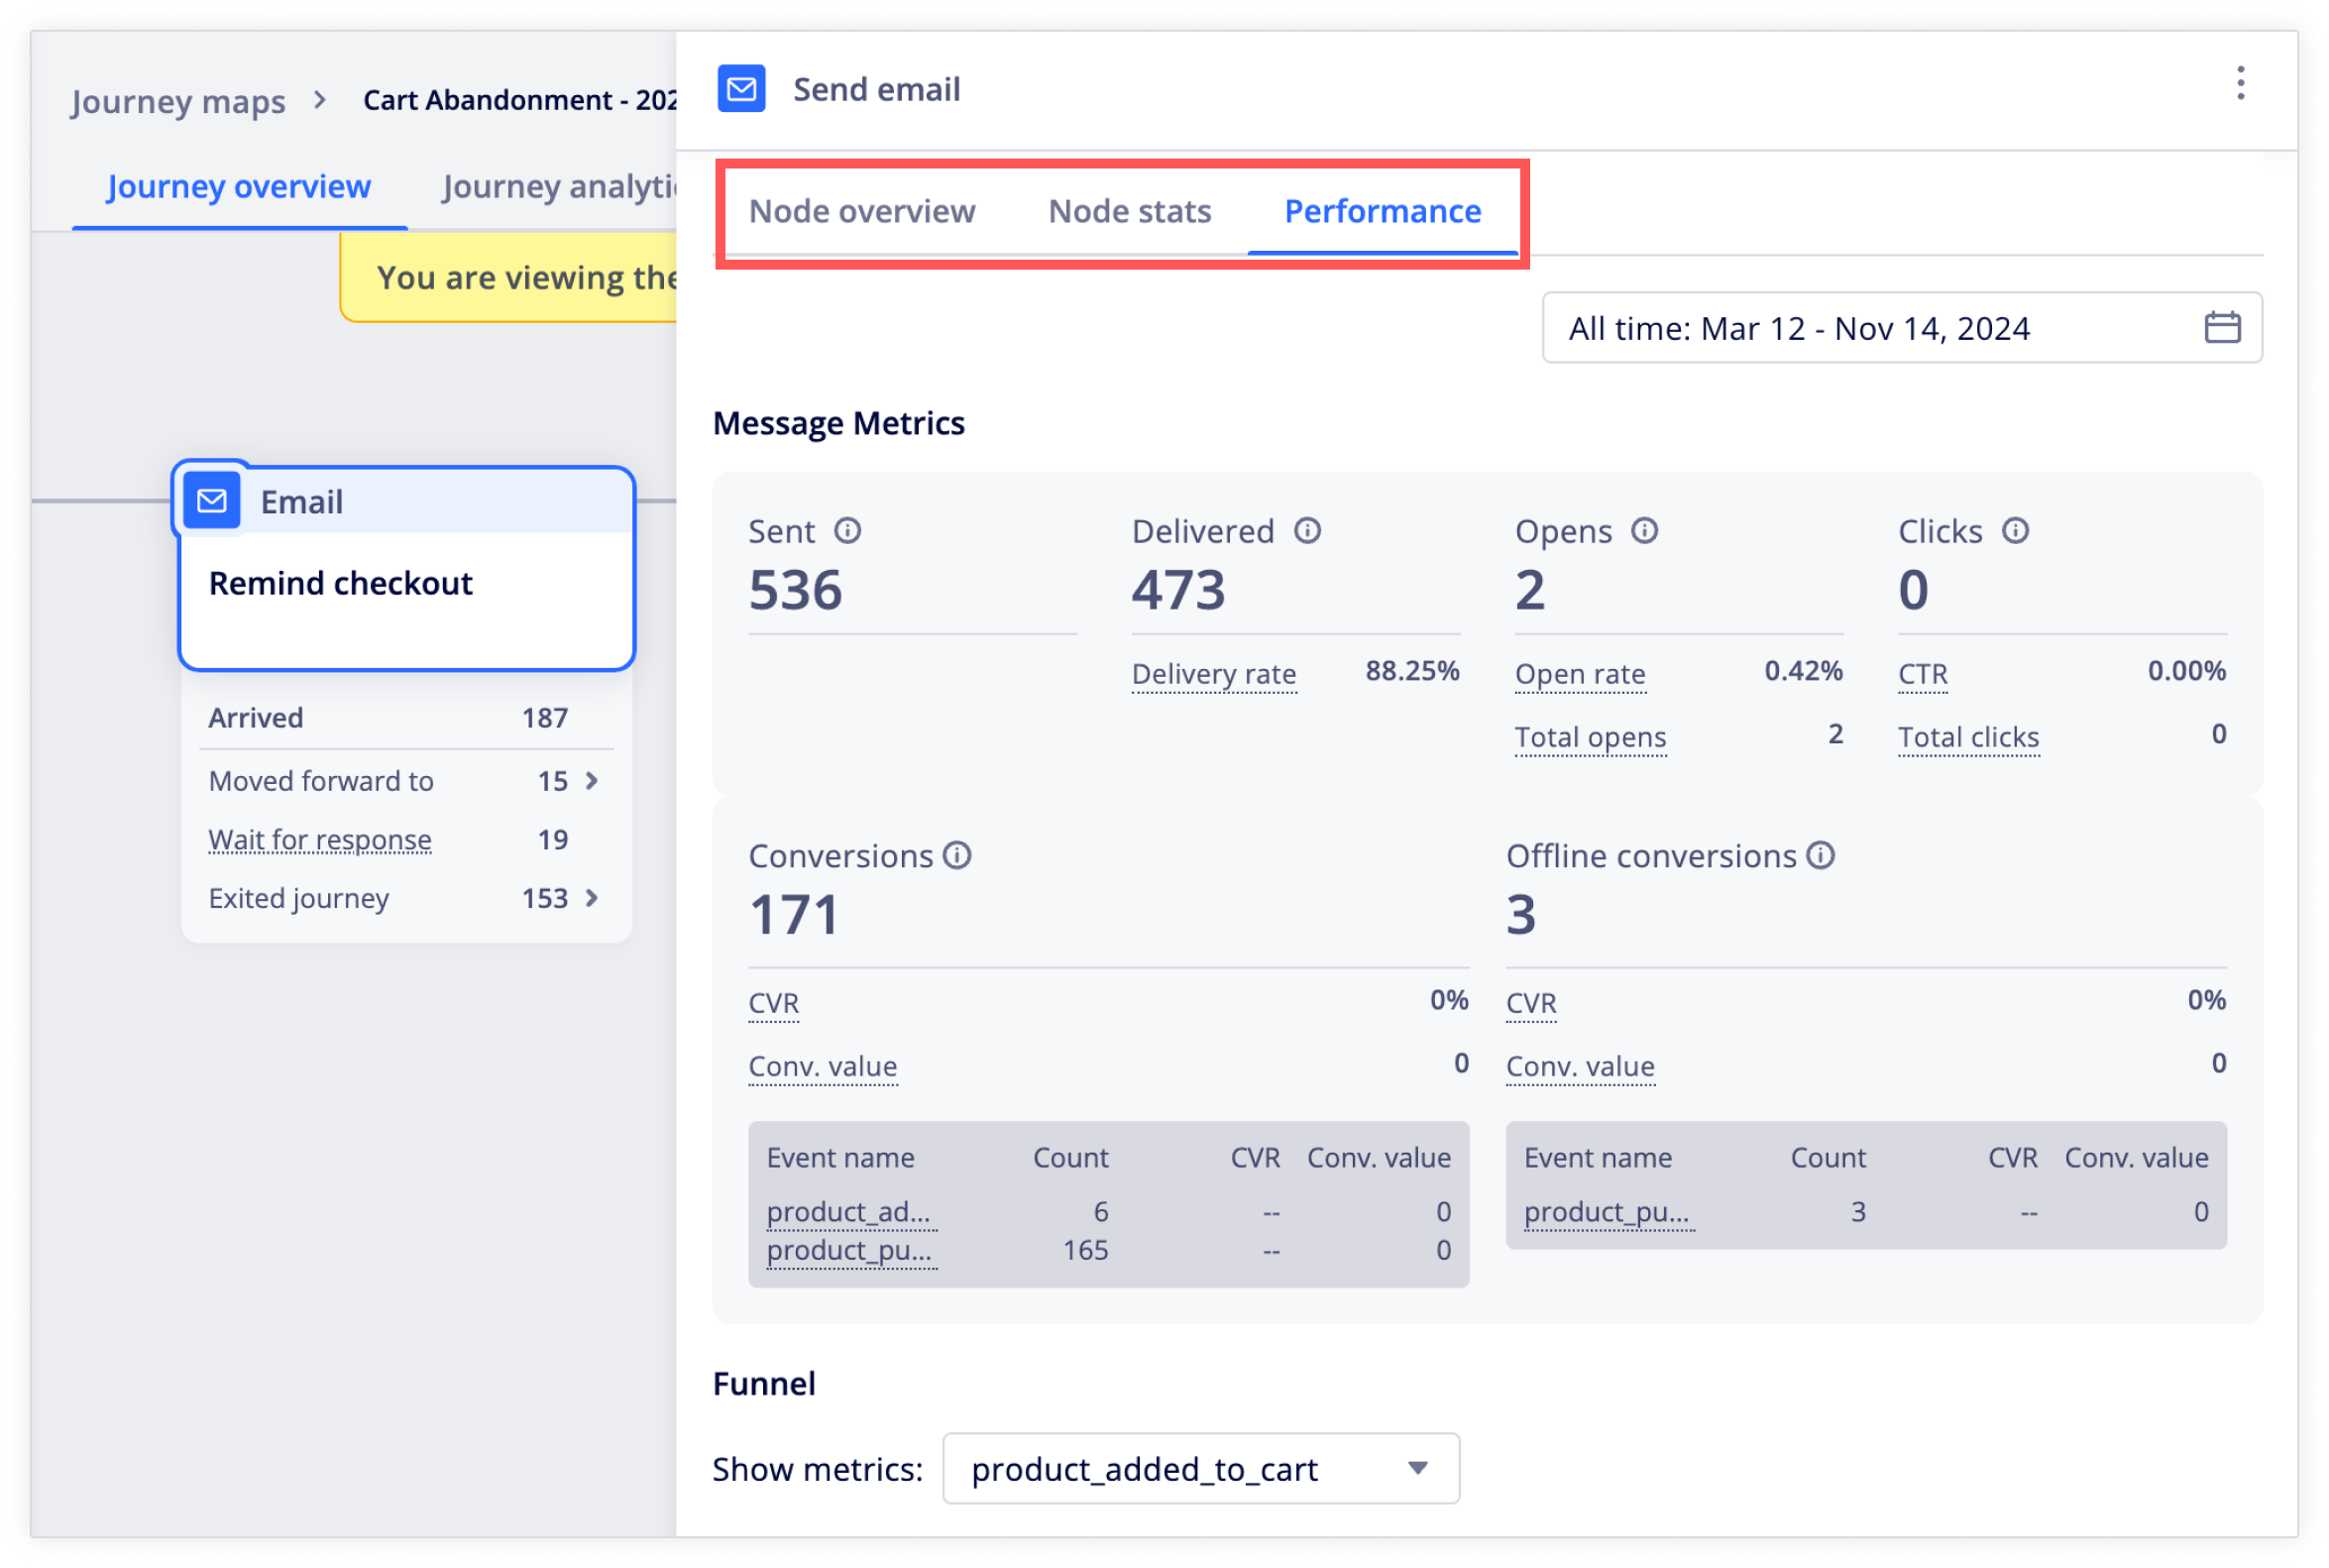
journey_map_entryevent is generated when a user enters. - Arrived: The number of users who arrived at this node. In message nodes, this is the number of users the system has tried to send the message to. To see the actual sent, views, delivered, and clicked metrics, open the message node and see the Performance tab instead.
- Moved forward to: The number of users who have moved on to the next node. If there are multiple paths after this node, you can click the expand arrow to see the user counts for each path. In message nodes, if the user interaction (e.g. a click) happens after the timeout period has passed, the user will still remain in the no interaction path (e.g. not clicked path).
- On hold: The number of users who are on hold at this node for a fixed duration or until a time slot.
- Wait for response: The number of users who are kept at the message node until they interact with the message or until timeout.
- Exited journey: The number of users who exited the journey at this node. Click the expand arrow to see the following numbers. If journey events are enabled for your account, a
journey_map_exitevent is generated when a user exits.- Exit rule met: The number of users who exited the journey by completing the exit event specified in the exit rule.
- Dropped: The number of users who exited the journey because they were not reachable in the channel. For example, users who entered the email message path in the journey but do not have a valid email address.
- Complete: The number of users who completed and exited the journey because they reached an exit node in the flow.
Node details
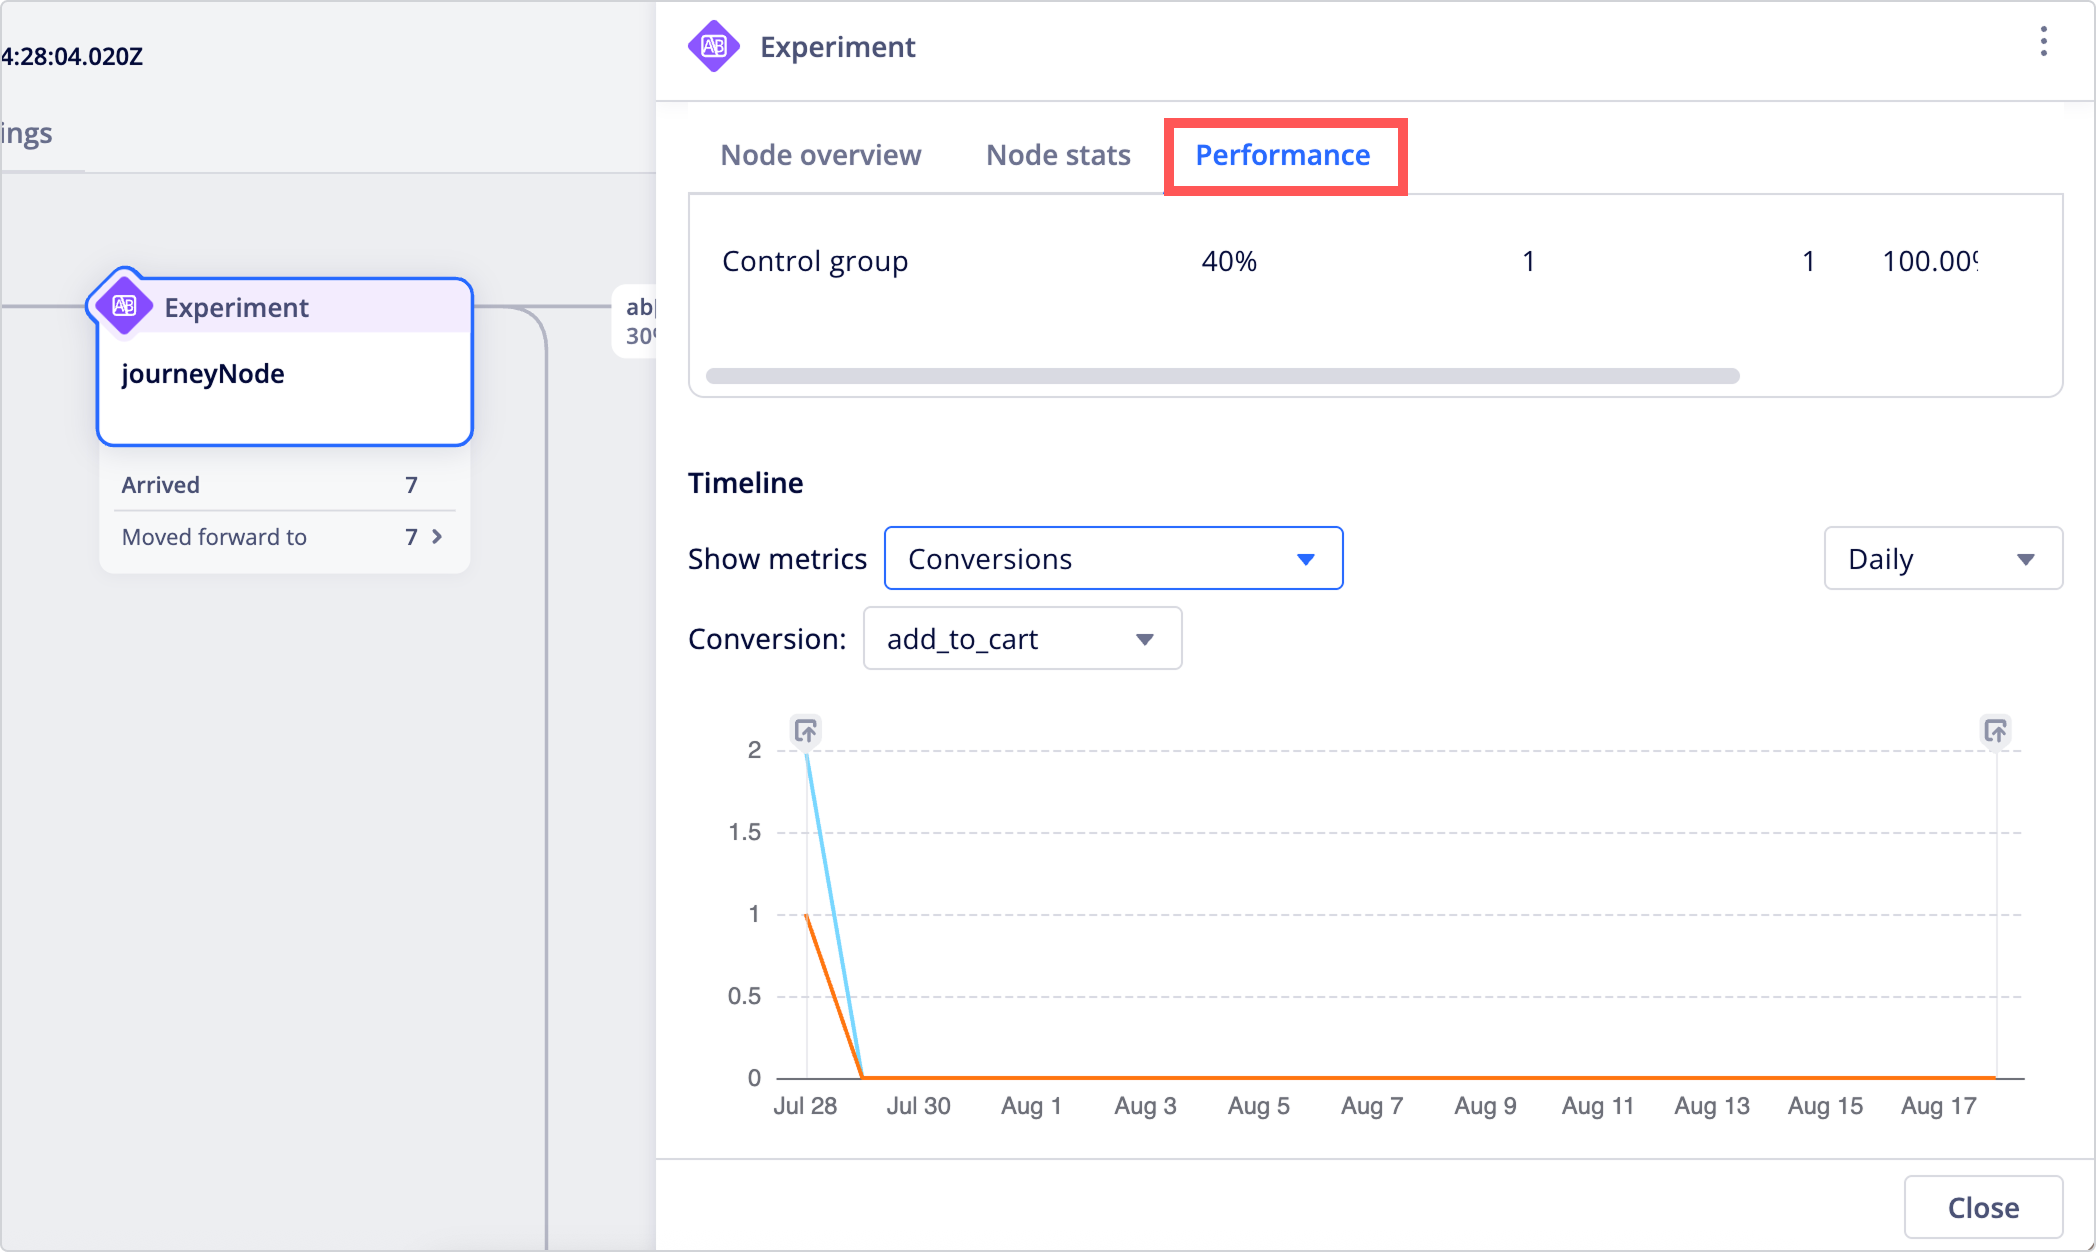
Click on a node to open a panel containing several tabs with different types of node details.
| Tab | Description |
|---|---|
| Node overview | Shows the summary of the node conditions or message content. |
| Node stats | Shows the number of users who arrived at the node, moved forward to the next node, are currently being held at the node, and exited the journey while they are at the node. |
| Performance (Experiment node) | Shows the traffic allocation and user count and conversion metrics for each path. For nodes with the control group enabled, conversion rate uplift (CVR uplift) is also shown.
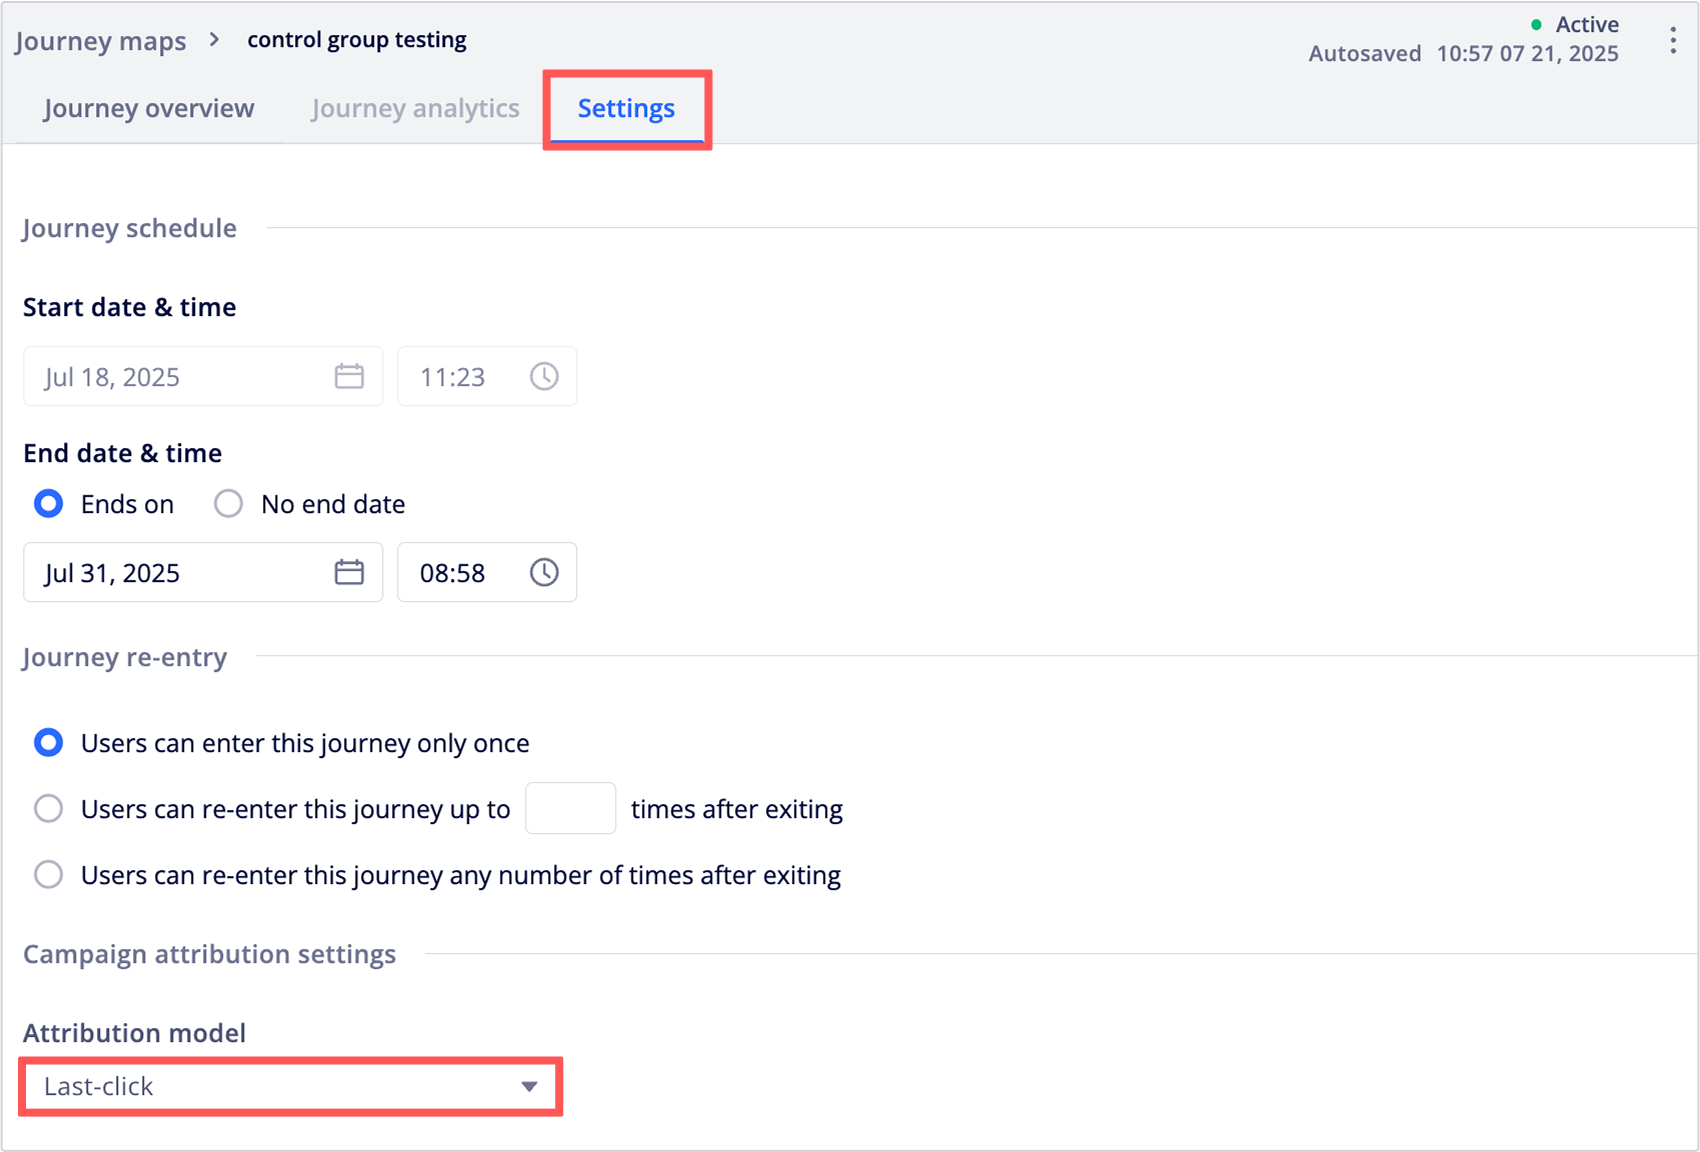
You can also change the attribution model of an active journey from the Settings page.
|
| Performance (Message node) | Shows delivery status, campaign performance data, and a detailed breakdown of conversion metrics.
|
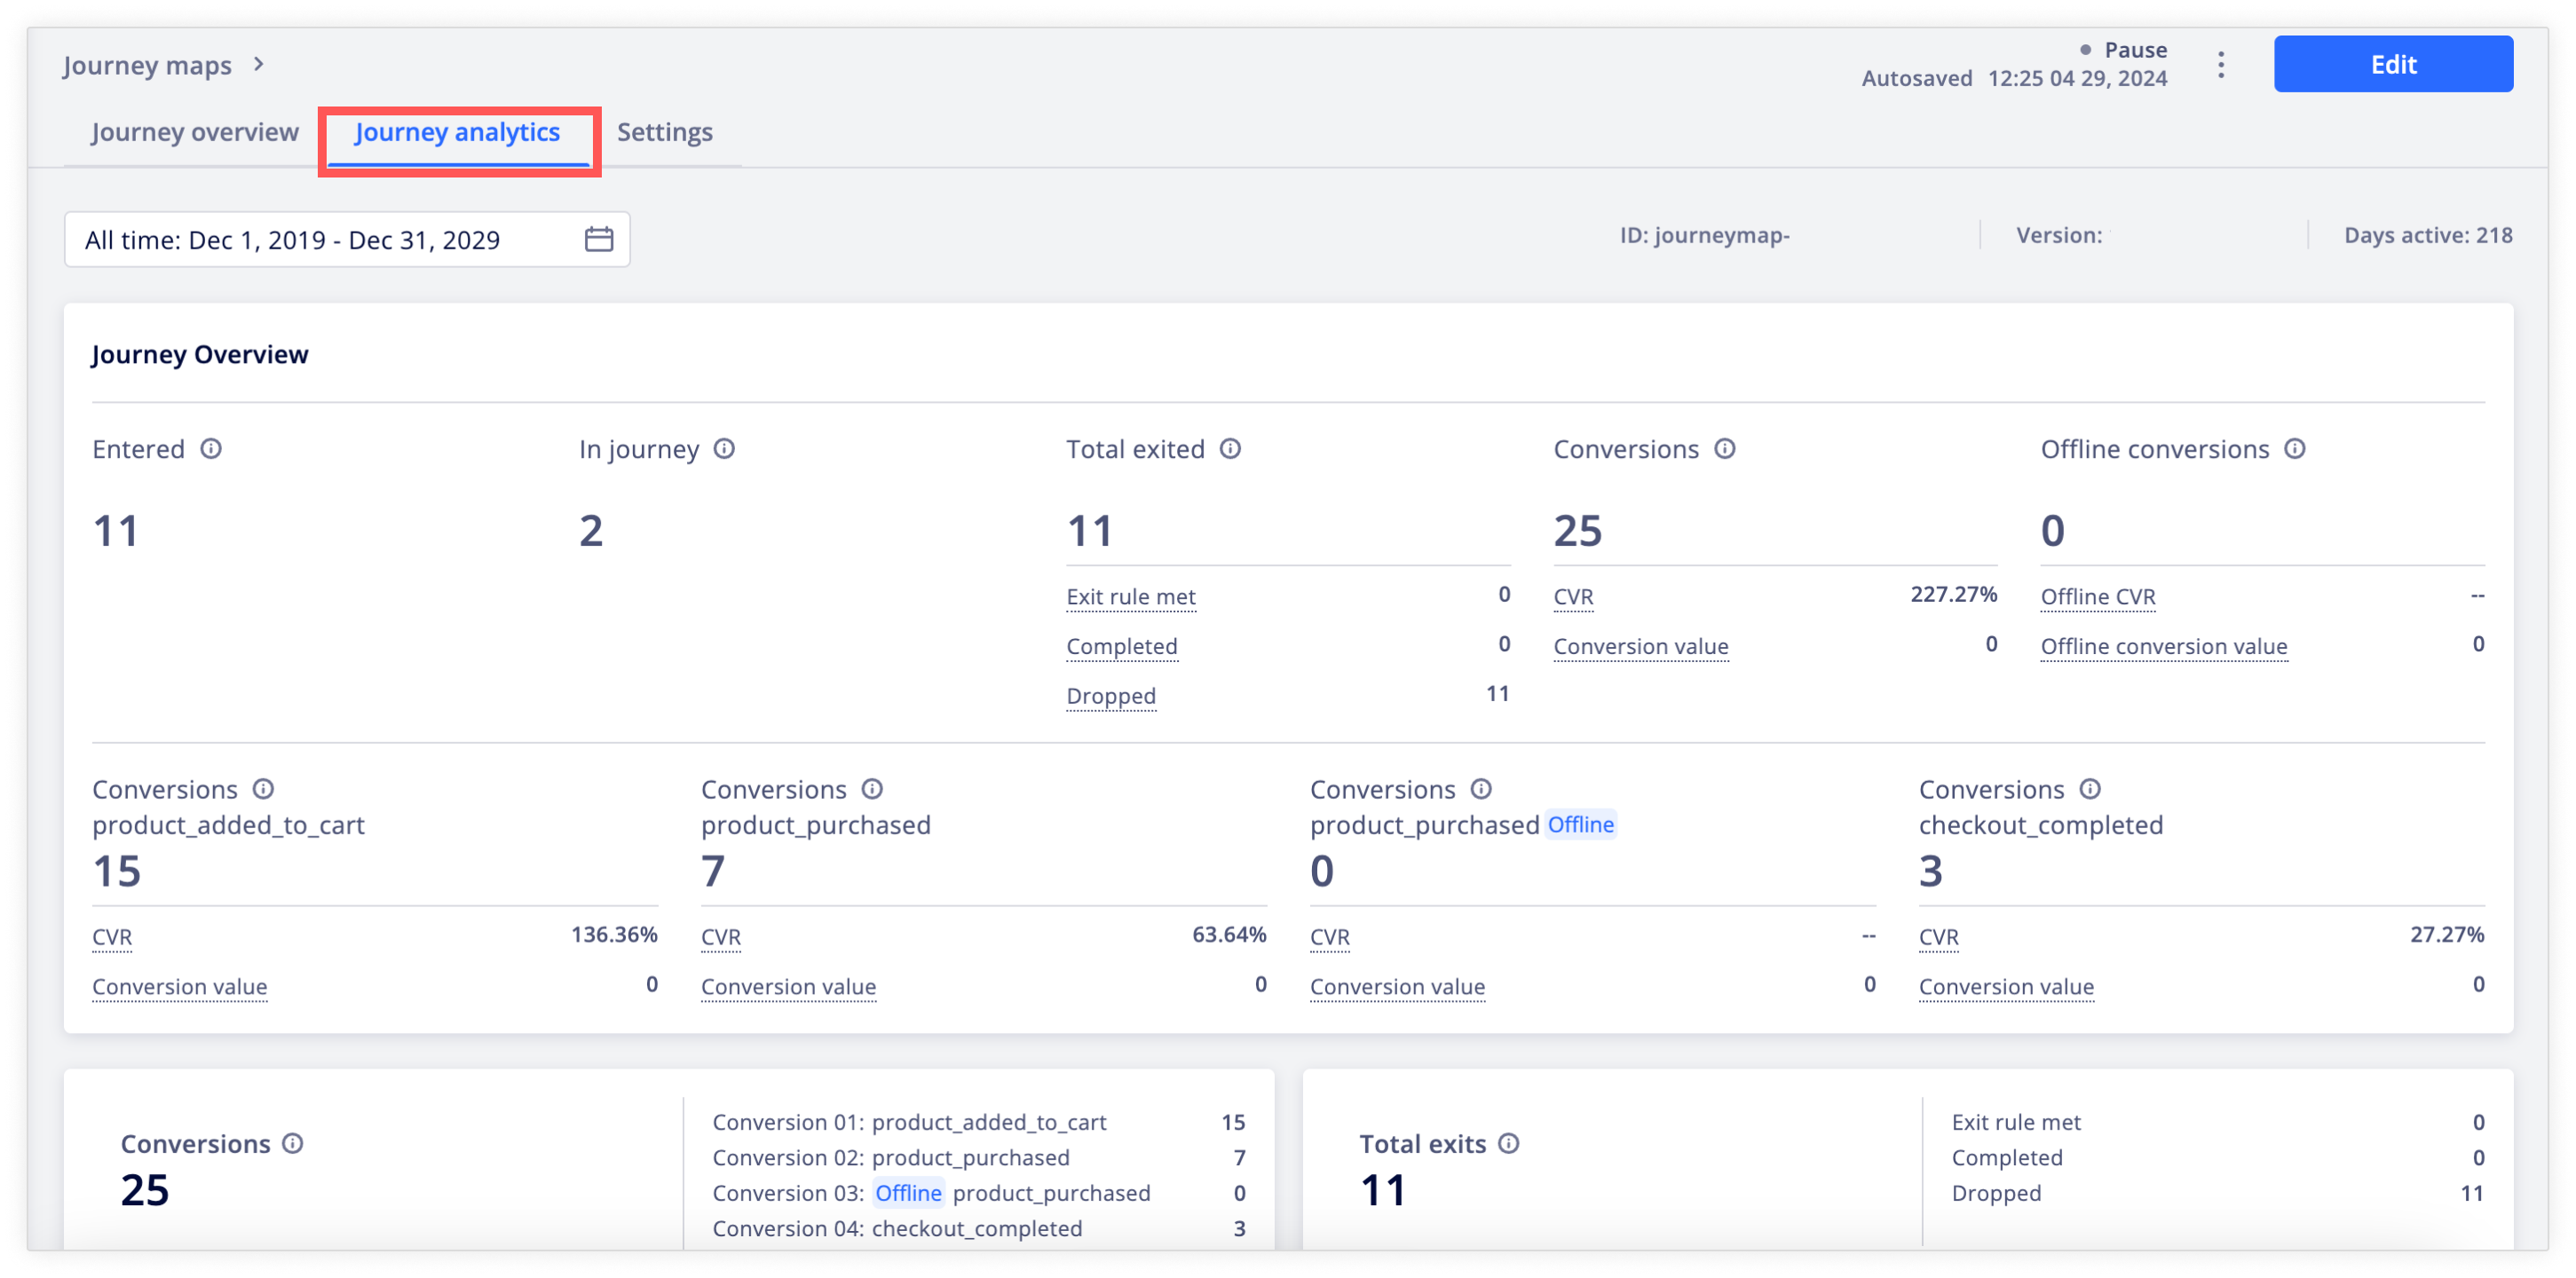
Journey analytics
Open the journey and click the Journey analytics tab to view key performance metrics and visualized trends for conversions, conversions value, total exits, and total clicks of your journey.
Using the date range selector and interval drop down menu to analyze data across different time periods.
Journey map list
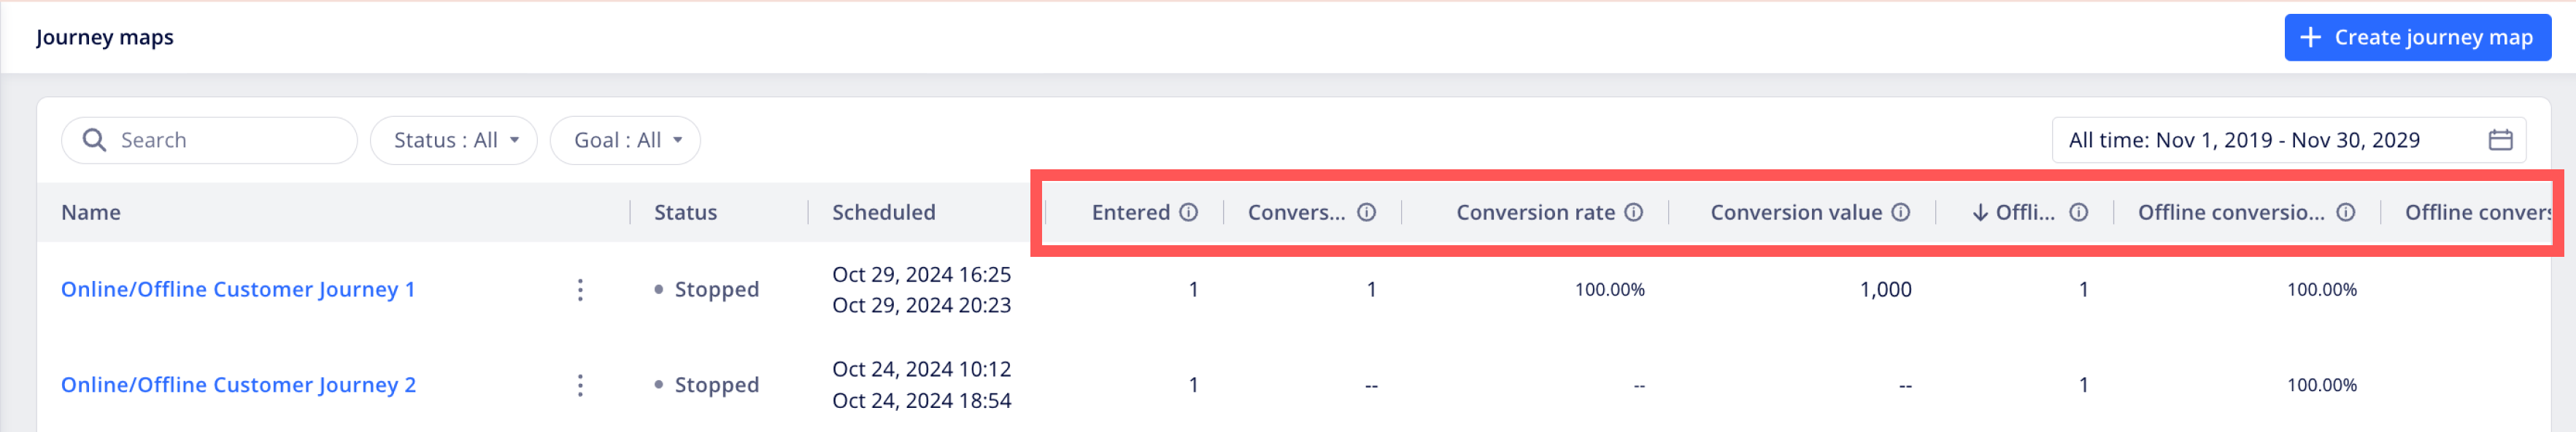
In the journey map list, you can see the following performance metrics of the journeys.
- Entered: The number of users who met the trigger condition and started the journey. Re-entered users are counted each time they enter.
- Conversion: The total number of conversion events completed by users who entered the journey.
- Conversion rate: Calculated using (Conversions / Entered) x 100%.
- Conversion value: The total value of online conversions from all channels in the journey.
- Offline conversions: The total number of offline conversion events completed by users who entered the journey.
- Offline conversion rate: Calculated using (Offline conversion events / Entered) x 100%.
- Offline conversion value: The total value of offline conversions from all channels in the journey.
- Exit rule met: The number of users who exited the journey by completing the exit event specified in the exit rule.
- Completed: The number of users who finished the journey after reaching the last node of a path, excluding the not-reachable paths.
- Dropped: The number of users who exited the journey because they were not reachable in the channel. For example, users who entered the email message path in the journey but do not have a valid email address.
FAQ
See FAQs related to analytics and performance here.
Updated 26 days ago